Download
1 / 108
1.08k likes | 1.09k Views
Visualization is the visual representation of data and information, bringing together traditional sciences and computer graphics. It allows for comparing, distinguishing, indicating directions, locating, relating, representing values, and revealing objects. This article explores the history, definition, and applications of scientific visualization.

E N D
Visualizacija, računalniška grafika, znanost Visualization brings together two disparate fields, the traditional sciences (like physics, chemistry, biology, for example) and computer graphics
Cilji vizualizacije • Comparing: images, positions, data sets, subsets of data. • Distinguishing: importance, objects, activities, range of value. • Indicating directions: orientations, order, direction of flow. • Locating: position relative to axis, object, map. • Relating: concepts, e.g. value and direction, position and shape, temperature and velocity, object type and value. • Representing values: numeric value of data. • Revealing objects: exposing, highlighting, bringing to the front, making visible, enhancing visibility.
Ena od definicij • The broad class of computer graphic and imaging techniques used to create visual representations of data. • Wolff and Yaeger, Visualization of Natural Phenomena, ELOS, Springer-Verlag, 1993
Kaj je znanstvena vizualizacija? • the mapping of data and/or information to images to gain or present understanding and insight • the visual analysis of scientific data. It transforms the numeric representation into a geometric (image) representation, enabling a scientist, engineer, or mathematician to observe his simulated or measured data • Scientific Visualization encompasses and unifies the fields of computer graphics, image processing, computer vision, computer-aided design, signal processing, and human-computer interaction • Scientific Visualization is a set of software tools coupled with a powerful 3D graphical computing environment that allows any geometric object or concept to be visualized by anyone. The software provides an easy to use interface for the user. The hardware must be able to manipulate complex, geometrically-described, 3D environments in motion, color, and with any level of “realism” called for to better communicate the essence of the computation (in foreword of An Introductory Guide to Scientific Visualization. R. A. Earnshaw & N. Wiseman, Springer-Verlag, 1992) • SciVi, SciViz, SciVis, SV, ...
Zakaj znanstvena vizualizacija? • “The purpose of computing is insight, not numbers” Richard Hamming (1962) • “Maintain a Healthy Skepticism: Never believe the results of your calculations. Always look for errors, limitations, unnatural constraints, inaccurate inputs, and places where algorithms break down. Nothing works until it is tested, and it probably does not really work even then. This skepticism should help avoid embarrassing situations, such as occur when a neat physical explanation is painstakingly developed for a computational blunder.” E. S. Oran & J. P. Boris (1987) • “In decreasing order of importance, scientific visualization: - shows you where you are screwing up - allows discoveries - is useful for show-and-tell” J. J. O’Brien (1993)
NLM Visible Human Project • An outgrowth of the NLM's 1986 Long-Range Plan. • Creating a complete, anatomically detailed, three-dimensional representations of the male and female human body. • The current phase of the project is collecting transverse CT, MRI and cryosection images of representative male and female cadavers at one millimeter intervals.
Visualising Non-Physical Systems User can click on frequency bar to see which hosts were the targets of the events Time Days in May Frequencies of Each Event Over Time Event Class (Vulnerabilities & Attacks)
Visualising Non-existing Systems Eg Visual Interactive Simulation Systems Modelling
Visualization in Computational Science • Computational Science refers to the knowledge and techniques required to perform computer simulations and tackling computationally intensive problems. • Main goal of Computational Science: • To understand the workings of nature • Steps • Observations, Physical Model, Mathematical Model, Numerical Model, Simulation and Analysis
The Research Triangle Theoretical Science Experimental Science Computational Science
Domene raziskovanja Experimentalist’s Domain Observations Theorist’s Domain Physical Model Computational Scientist’s Domain Mathematical Model Numerical Model Simulation & Analysis
Computational Cycle Summarize Research Analyze Program Simulate Compute
Analysis Cycle Summarize Simulate Raw Data Playback Filter Data Images Data Geometric Primitive Renderer Mapping
Od resničnosti do slike Reality Experimental Model Mathematical Model Better Data Data Visualization Better Picture Picture
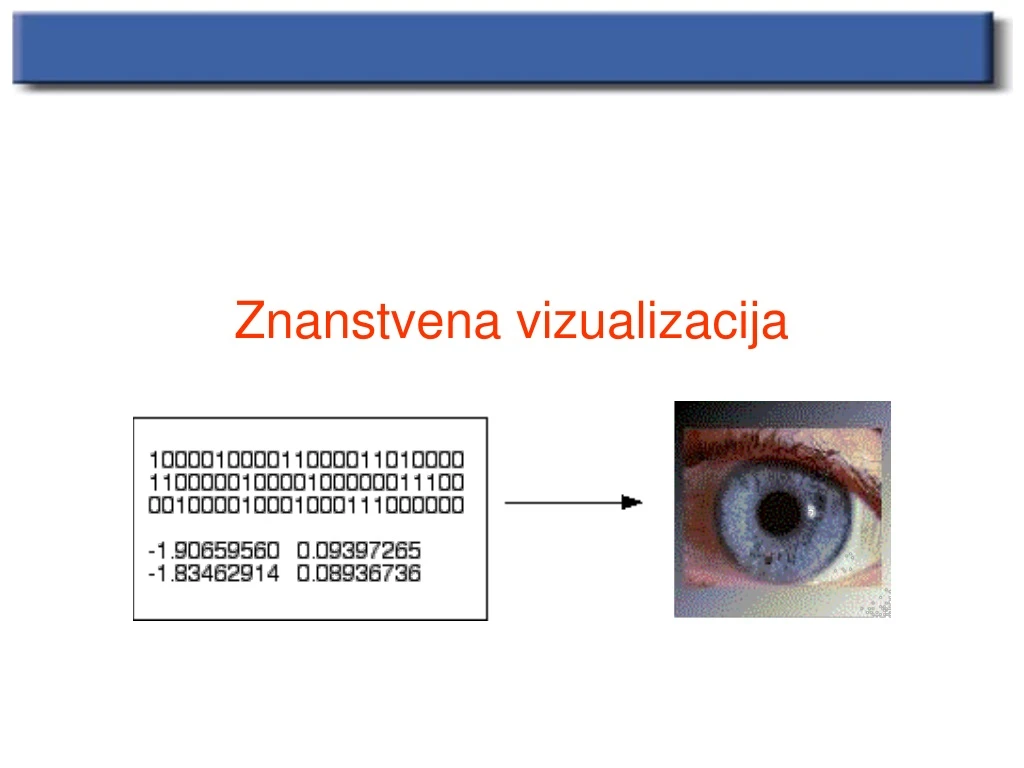
Zakaj vizualizacija podatkov? A Picture is worth a Million Bytes 34 4F D2 73 89 2E 12 90 E1 45 36 FF FF 6A B4 78 54 23 D2 AA 38 90 87 54 DD C2 FF 89 00 76 Data Information
Proces znanstvene vizualizacije Summarize Data Source Filter Playback Data Data Images Render Mapping Mapping Geometric Primitives
Types of Source Data • Measured (sensed, observed, experimental) • Simulated (computed)
Predstavitev podatkov za vizualizacijo Computational Methods Transform Data Measurement Map Display Modelling
Possible Research • Visualization of time-dependent motion • Change of topology • Interactive feature extraction • Interactive exploration • Use of force feedback in visualization • Handling of Multi-Gigabyte datasets • Exploration of high-dimensional spaces
Types of Scientific Visualization • I See • interactive • exploratory • softcopy display • minimal contextual information • We See • interactive • exploratory • softcopy display • more context/explanation needed • They See • presentation usually • not interactive • not exploratory • hardcopy display • lots of context/explanation needed
Primeri iz programa Mathematica ParametricPlot3D[{t*Cos[t^2], t*Sin[t^2],t}, {t,0,2Pi},PlotPoints->200] ParametricPlot3D[{Cos[u] Cos[v], Sin[u] Cos[v],Sin[v]},{u,0,2Pi}, {v,-Pi/2,Pi/2}]
Primeri iz programa Mathematica f[x_,y_]=(x^2-3)y^2; cpone=ContourPlot[f[x,y],{x,-3,3}, {y,-1,1}, DisplayFunction->Identity]; cptwo=ContourPlot[f[x,y],{x,-3,3}, {y,-1,1}, ContourStyle->GrayLevel[.7], ContourShading->False, DisplayFunction->Identity]; Show[GraphicsArray[{cpone, cptwo}]] Plot3D[Cos[Sin[x]+Cos[y]], {x,0,2Pi},{y,-Pi,Pi}]
Dimenzije in tipi podatkov • domain (independent variables) • 2D, 3D, 4D, etc. • if the data points are not connected: scattered • if the domain is gridded: • rectilinear (uniform [regular] or non-uniform [irregular]) • cubes: with data points at vertices, on faces, or in the center • curvilinear • distorted cubes, but 6-connectivity at nodes, analogy is a distorted sponge • unstructured • 2D - triangles • 3D – tetrahedra, prisms, pyramids, or hexahedra • range (dependent variables) • scalar (pressure, density, temperature, voltage, height, salinity) • vector (velocity, current, gradient, etc.) • tensor (stress, strain, etc.)