Download
1 / 45
450 likes | 687 Views
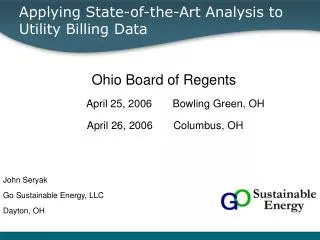
Applying State-of-the-Art Analysis to Utility Billing Data. Ohio Board of Regents April 25, 2006 Bowling Green, OH April 26, 2006 Columbus, OH. John Seryak Go Sustainable Energy, LLC Dayton, OH. My Experience. Bachelor and Master’s in Mechanical Engineering from UD

E N D
Applying State-of-the-Art Analysis to Utility Billing Data Ohio Board of Regents April 25, 2006 Bowling Green, OH April 26, 2006 Columbus, OH John Seryak Go Sustainable Energy, LLC Dayton, OH
My Experience • Bachelor and Master’s in Mechanical Engineering from UD • Several years of experience working with Ohio/New England/New York state and utility energy efficiency programs • Energy assessments • Demand reduction (permanent, load-shedding, peak generation) • Technical assistance • Program consulting (measure life, lean manufacturing & energy) • Commissioning teams and retro-commissioning studies • Industrial ecology • Approx. 100 facilities evaluated
Core services • Utility & energy data statistical regression analysis • Energy assessments • Technical assistance (focused projects) • Instructional • Also, • Incentive packages - GHG emissions credits; federal tax incentives; state loans & grants; utility rebates • Next generation - Industrial ecology, biomimicry, sustainable product design • Long-term demand-side management
HB 251 – For State Institutions of Higher Education • Goal to reduce building energy consumption by 20% by 2014 • 2004 is benchmark year • Creation of energy efficiency standards for new buildings >$100,000 in cost • Each board must have a 15-year plan for phasing in energy efficiency projects
HB 251 – It makes sense! • Goal to reduce building energy consumption by 20% by 2014 • 2.7% reduction per year from now until then • No big deal… • Refrigerators 5.5% improvement per year for past 30 years – standards • Economy 2.25% improvement with high prices - incentives
HB 251 – For State Institutions of Higher Education • Creation of energy efficiency standards for new buildings >$100,000 in cost • Each board must have a 15-year plan for phasing in energy efficiency projects • $250 million project….$0.00 spent on evaluating energy operating cost
Our Analysis: How Does It Help These Efforts? • Benchmark energy use • Measure energy savings, track improvements • Normalize weather, occupancy, enrollment, other • Identify energy savings • Evaluate energy signatures • Past-performance benchmarking • Multi-facility benchmarking
Our Analysis • State-of-the-art analysis • Complementary to EnergyStar – 6 metrics+ instead of one • Expert analysis – highest quality returns - good advice will save you time and money in the long run • Clean database – trustworthy results • Our higher education clients • California State University • Campus level • Facility level
State-of-the-Art Analysis: What is it? • Energy Informatics • Extracting useful information from energy data sets • Multi-variable change-point statistical regression (MVR) models • We call them Energy Signatures for short • Graphical and mathematical model • Regression beyond Excel • Inverse Modeling • Interpreting the physical significance of the energy signature parameters
Who Uses It? • EModel: Texas LoanSTAR Program • Advanced PRISM: Princeton Center for Energy and Environmental Studies • IMT: ASHRAE Guideline 14 on Measurement and Verification • ETracker: U.S. EPA Energy Star Buildings Program • Regression Method: International Performance Measurement and Verification Protocols
MVR, What is it Good for? • Baselining energy use • Normalizing energy use • Forecasting energy use • Identifying energy reduction opportunities • Past-performance and multi-building benchmarking • Continual monitoring • Measurement of energy savings
Why use it? • Powerful analysis tool • Next generation temperature normalization • HDD/CDD Actual temperature data and TMY2 • Its There! – Data is readily available • Utility data (except for un-metered buildings!) • Temperature data – free on web • engr.udayton.edu/weather • Weatherunderground.com
MVR Analysis of Utility Billing Data: Overview • 1. Characterize performance with ‘Energy Signature’ model • 2. Remove noise with ‘Normalized Annual Consumption’ NAC • 3. Track performance with ‘Past Performance Benchmarking’ - ‘Sliding NAC’ analysis • 4. Compare performance with ‘Multi-Facility Benchmarking’ analysis
Data Requirements Monthly electricity and fuel use: utility bills Actual outdoor air temperature Typical outdoor air temperature Influential variables (optional) • Floor area, occupancy, sales, production, etc.
1. Characterize Performance with ‘Energy Signature’ Model • Develop 3PC or 3PH energy signature model • Disaggregate energy use • Identify energy saving opportunities • Expected shape • Coefficient analysis • Fit analysis
Load Gas and Temperature Data 3 Years of Gas Bills 3 Years of Temperature Data
Three-parameter Heating (3PH) Model HS Eind Tbal Gas Use = Eind – HS (Tbal – Toa)+
Three-parameter Cooling (3PC) Model CS Eind Tbal Elec Use = Eind + CS (Toa – Tbal)+
Physical Meaning of Coefficients • Eind = Temperature-independent energy use • Tbal = Balance temperature = Outdoor temperature where heating/cooling begins = Tsp – Qint/UA • HS = Heating Slope = Heating energy per degree below Tbal = UA/Eff_Heater • CS = Cooling Slope = Cooling energy use per degree above Tbal = UA/Eff_AC UA = building conductance x area Tsp Qint
Add Additional Variables For Industrial, Commercial, Retail Facilities • Add additional independent variables (IV) to make 3P-MVR models • Gas Use = Eind + HS x (Tcp -Toa)+ + (IV1 x Occupancy) + (IV2 x Sales) … • Elec Use = Eind + CS x (Toa - Tcp)+ + (IV1 x Occupancy) + (IV2 x Sales) …
Energy Saving Opportunities:‘Lean Energy’ Breakdowns • Lean Manufacturing: Any ‘activity’ that does not directly add value to the product is waste • Lean Energy: Any ‘energy’ that does not directly add value to the product is waste. • Hence, ‘independent’ energy use is energy that does not vary with production or weather, and may be waste. • Target independent energy use for savings opportunities.
Lean Energy Breakdown: High Independent Electricity Use Equipment left on when not in use • Lights • Computers • Vending machines • Poor load-following behavior • Un-staged air compressors • Throttled pumps • Part-loaded chillers • No load-following behavior • Constant-volume pumping • Constant-volume air flow • Compressed air leaks
Lean Energy Breakdown: High Independent Fuel Use • Equipment left on when not in use • Ovens, furnaces, boilers • Poor load-following behavior • Boilers with load/unload control • No load-following behavior • Reheat/cooling interaction
Using Models to Identify Problems: Chillers Left On R2 = 0.92 CV-RMSE = 22.4%
Using Models to Identify Problems: Malfunction Economizer R2 = 0.70 CV-RMSE = 7.8%
Using Models to Identify Problems: High Scatter = Poor Control R2 = 0.59 CV-RMSE = 68% Observation Heating energy varies by 3X at same temp! Discovery Didn’t close shipping doors!
Using Models to Identify Success:Low Scatter = Good Control R2 = 0.99 CV-RMSE = 1.1%
Measuring Actual Savings:Insulation Average savings = 24.2 ccf/month = 290 ccf/yr
Normalized Annual Consumption: NAC • Utility bills tells us ‘Annual Consumption’, which how much energy facility consumed with weather, sales, production, etc. that actually occurred • We want to know how much energy building would have consumed during ‘normal’ weather, sales, production, etc. • This is called ‘Normalized Annual Consumption’ NAC • Calculating NAC is a two step process.
Calculating NAC:Step 1 of 2: Actual gas bills + Actual weather data = Energy signature model
Calculating NAC:Step 2 of 2: Energy signature model + Typical weather = NAC
NAC is “Noisefree” Energy Consumption • NAC removes ‘noise’ from variable weather • NAC reveals true energy use characteristic of facility • NAC allows comparison of sites with different weather
Past-Performance Benchmarking • Track ‘Noiseless’ Performance with ‘Sliding NAC’ Analysis • Calculate NAC for every twelve month period in data set. • Change in NAC indicates change in building energy use characteristic • Understand change in NAC by examining change in energy signature coefficients
Multi-Facility Benchmarking • Quantify average energy performance and distribution of energy performance across all sites • Benchmark best/worst NAC and change in NAC • Benchmark best/worst coefficients and change in coefficients
Let the Data Speak: Summary • Characterize Performance with ‘Energy Signature’ Model • 3PC-MVR or 3PH-MVR baseline model • Disaggregate energy use (Lean Energy Analysis) • Identify energy saving opportunities • Measure ‘actual’ savings • Remove Noise with ‘Normalized Annual Consumption’ NAC • Reveals true energy use characteristic of facility • Allows comparison of sites with different weather, sales, prod, etc. • Track Performance with ‘Sliding NAC’ Analysis • Identify problems/improvements when they happen • Understand nature of change with coefficient analysis • Benchmark Performance with ‘Multi-site Sliding NAC’ Analysis • Determine center and spread of NAC and coefficients • Benchmark best/worst NAC and change in NAC • Benchmark best/worst coefficients and change in coefficients
Thank you! questions to jseryak@gosustainableenergy.com (937) 474-5196