Download
1 / 32
320 likes | 507 Views
Impacts of the 2007 Adoption of ODG-TWC Treatment Guidelines on Medical Utilization and Costs. A Preliminary Report September 28, 2009. Workers’ Compensation Research & Evaluation Group Texas Department of Insurance http://www.tdi.state.tx.us/wc/regulation/roc/.

E N D
Impacts of the 2007 Adoption of ODG-TWC Treatment Guidelineson Medical Utilization and Costs A Preliminary Report September 28, 2009 Workers’ Compensation Research & Evaluation Group Texas Department of Insurance http://www.tdi.state.tx.us/wc/regulation/roc/
Reforms Affecting Utilization • Changes in medical service utilization and costs may be affected by • Physician fee schedule • TAC §134 Subchapter C. • Preauthorization requirements • TAC §134.600 • Treatment guidelines • TAC § 137.100 TAC rules are based on legal mandates in Texas Labor Code 413 Subchapter B. Medical Services and Fees
Factor 1: Physician Fee Schedule • Changing unit prices of health care services • HB 2600 (2001) • 125% of Medicare (effective May 2003) • Relative impacts on service prices • Evaluation & Management • Physical medicine
Factor 2: Preauthorization Requirements • Targeted medical necessity & utilization guidelines/reviews • First implemented in 1991 • Non-emergency inpatient hospital admissions • Outpatient surgical or ambulatory services • In 2002 • Spinal surgery • In 2004 • Work hardening/conditioning • Rehabilitation services • In 2005 • Physical and occupational therapies
Factor 3: Treatment Guidelines • HB 2600 (2001) repealed treatment guidelines • HB 7 (2005) authorized the Commissioner to adopt treatment guidelines and/or individual treatment protocols that are ‘evidence-based, scientifically valid, and outcome-focused’ (TLC §413.011) • TDI-DWC adopted the Official Disability Guidelines – Treatment in Workers’ Comp (ODG-TWC) as the treatment guidelines effective May, 2007, for all non-emergency, non-network health care
Effects of Pre-ODG Adoption Reforms Trends in total and average costs per claim • Total cost declined from 2003 • 2003: new fee schedules • 2004: pre-authorization for work hardening/ conditioning • 2005: preauthorization for PT/OT • Average cost stable or increasing • Fewer claims * 2004 data are omitted due to data problems.
Trends in Number of Claims Total number of claims by service year, by injury year • Includes indemnity & medical-only claims • Mirrors injury rates (an increase in 2006) • Two thirds are new injury claims in each service year – one half with indemnity claim • Relative shares of ‘old’ injuries are stable
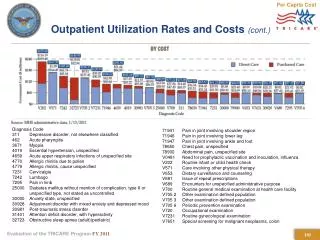
Total Costs by Medical Type • Professional: declining total costs • Hospital: relatively high costs; rapid increase until 2007 • Pharmacy: increased until 2007 Note: All data in this presentation are by service year unless noted otherwise.
Average Costs per Claim by Medical Type • Average cost per claim is stable. • Increasing cost in hospital services (till 2007) • Decreasing cost in professional services • Steady increases in pharmacy costs • Averages are calculated using the number of claims receiving at least one particular service.
Number of Claims by Injury Type • Treatment paths, maturity, cost spreads are different • Low-back • Upper extremities • Lower extremities • Shoulder • Neck • Knee • Assigning body part complicated by multiple primary ICD9s
Number of Claims Receiving a Serviceby Provider Type • Most receive at least one MD/DO service • PT/OT services are next most common, but under 20% of claims receive these services • DC third most frequent in 2005, but sixth in 2008
Share of Claims Receiving Servicesby Provider Type • 2006: Injured workers received a wider range of service types increased utilization • 2007: trend reversed for most provider types • Increase in ‘others’ category • includes durable medical equipment (DME) Left scale
Percent of Claims by Provider Type Percent of claims receiving at least one service by provider type • In 2008, about 7.4% of injured workers received Chiropractic services, a 44% decrease compared to 13% in 2005. • MD/DO and Others increased share of injured workers receiving services their.
Utilization Patterns:Average Number of Services per Claimby Year after Injury • On average, claims show the highest level of utilization in the 2nd and 3rd years after injury • Consist of more severe, long-term injuries • Low averages in the 1st year are due to the inclusion of many, less severe, short term injuries. • Overall, significant decreases in utilization in 2006 (pre-ODG adoption), which continued in 2007 and 2008 (post-ODG adoption)
Utilization Patterns: Frequency & Intensityby Year after Injury Frequency: Number of visits per claim Intensity: Number of services per visit • Decrease in intensity • - Largest decrease in 2006 • - Large for both low and high severity • injuries • Frequency decreased faster than intensity
Utilization Patterns:Decrease in Utilization by Provider Type Overall utilization: number of services per claim • Significant and continuous decrease in Chiropractic services • Substantial decrease in PT/OT services in 2006, but decrease rate slowed after 2006 • Other provider types: minor changes in utilization
Utilization Patterns:Decrease in Utilization by Provider Type Decomposition into Frequency & Intensity Frequency:Number of visits per claim Intensity: Number of services per visit • Total utilization = (frequency) x (intensity) • Chiropractors with large decreases in frequency (38%) and intensity (17%, mostly in 2006) • MD/DO: minor decreases in frequency and intensity • PT/OT: frequency decreasing but intensity increasing
Billing Effects: MD/DO Typeby Service Groups Number of services per claim Rates of change Payment per service • Utilization decreasing at a higher rate since 2007 • Payment per service increasing • Spinal surgery changes most pronounced
Post-Billing Effects: Bill Review Patterns Post-Billing Effects Excessive/inappropriate services Denial of payment • Fee adjustment (reduced payment): 60% of total in 2005 65% in 2008 • Denied at about 20% • - Medical necessity denials • - Procedural denials • 10% - 14% of accepted bills/paid as billed • Less charges paid or denied • More charges reduced for fee adjustments Number of bills by bill review action
Post-Billing Effects: Bill Review Patterns Paid amount as a percentage of billed amount • Chiropractors (who showed fastest decrease in utilization) have the highest pay/charge ratio. • Most provider types experienced improved pay/charge ratios since 2007 • More carrier confidence in submitted bills? Possibly due to: • Reduction in excessive/ inappropriate bills • Lower total costs
Utilization Analysis Issue & Method • Question: the degree by which health care providers actually consult ODG-TWC in treatment planning and delivery • Observation and/or survey impractical • Method: Pattern analysis using similar samples before and after the ODG-TWC adoption • Compare distribution patterns of metrics (number of services per claim/median days before first service) • Statistical tests of similarity/dissimilarity of the distribution patterns
Utilization Pattern Analysis: Sampling • Soft tissue low-back injury cases • ICD9s: 724.2, 724.5, 724.8, 724.9, 846.0, 847.2, and 847.9 • 2005 cohort • New injuries between 1/1/2005 and 12/31/2005 • All services evaluated at 12 months maturity • 24,607 unique claims • 2007/2008 cohort • New injuries between 7/1/2007 and 6/30/2008 • All services evaluated at 12 months maturity • 22,821 unique claims
Utilization Pattern Analysis: Treatment Paths Path B: X-Ray/MRI/Surgery Path A: Activity modification, PT/OT, exercises, medication Soft tissue injuries; Texas samples
Rates Too High Median number same except top 5% No difference Utilization Pattern Analysis: Utilization
Later intervention Delayed service Utilization Pattern Analysis: Service Timing Same day: X-ray as a routine first service
Utilization Pattern Analysis: Result Summary • Utilization measures (median number of services) • Slightly lower # of E&M services, contrary to ODG-TWC recommendation • High % of X-Ray & MRI services for soft-tissue injuries • No change in X-Ray/MRI service delivery pattern to soft tissue injury cases • Service reductions generally limited to top 10% or 5% cases • Timing measures • E&M service takes more days (in outlying cases) • X-Ray services on the first visit (not recommended) and this pattern consistent pre and post-ODG • MRI and surgery patterns changed, more services delayed post-ODG
Effects on Return to Work Outcome • Comparisons of RTW rates for 2005 sample and 2007/2008 sample used in the previous utilization pattern analysis (soft-tissue low-back injuries) • ‘Within 3 months’ (initial) RTW rate is significantly higher for Post-ODG adoption sample • Initial RTW rates somewhat higher for Post-ODG adoption sample (6 months after injury) • Samples have lower RTW rates than those of the overall population
Effects on Medical Disputes • Medical necessity disputes declined significantly, especially after 2004 and 2006 preauthorization changes • Decline continued after 2007 ODG adoption • Preauthorization disputes increasing • Fee disputes increasing (unrelated to utilization disputes)
Conclusions • Excessive service utilization have reduced significantly since 2003. • From 2005 to 2008: • The number of claims decreased by 8%. • Total costs decreased by 24%. • Average claim cost lower by 17%. • 12% from preauthorization effect in 2006; 5% in 2007 from ODG guideline effect and residual preauthorization effect • Given stable fees, cost reductions are attributed primarily to decreases in service utilization.
Conclusions • Utilization reductions occurred mainly in ‘excessive’ physical medicine services, especially in chiropractic procedures. • Main force behind this decline is preauthorization requirements prior to the adoption of treatment guidelines. The rules subjected PT/OT services after the first 6 visits to prospective reviews (TAC §134.600) irrespective of treatment guidelines. • Due to their wide-ranging scope and treatment planning aspects, treatment guidelines may impact the MD/DO provider group the most. • Utilization and billing patterns of MD/DO indicate a downward trend beginning in 2007, possibly as a result of the guidelines’ adoption.
Conclusions • Reductions in service utilization are more general. • Utilization reduction by service providers resulted in less denials at bill review stage. • As voluntary reductions and preauthorization denials increase, medical necessity denials decrease. • Besides general reductions in extreme cases, specific, diagnosis-related treatment patterns have not changed significantly, with little indication that providers are consulting treatment guidelines to determine excessiveness and inappropriateness of particular services. • More post-ODG adoption time and data needed to determine full extent of the impacts.