Download
1 / 7
70 likes | 111 Views
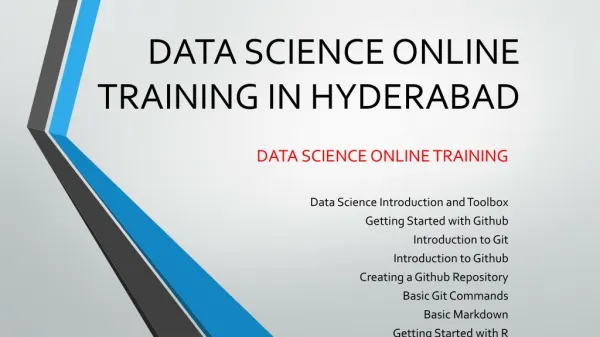
<br>Airis Trainings is a best training center for Datascience given corporate trainings to different reputed companies. In Datascience training all sessions are teaching with examples and with real time scenarios. We are helping in real time how approach job market, Datascience Resume preparation, Datascience Interview point of preparation, how to solve problem in Datascience projects in job environment, information about job market etc. Training also providing classroom Training in Hyderabad and online from anywhere

E N D
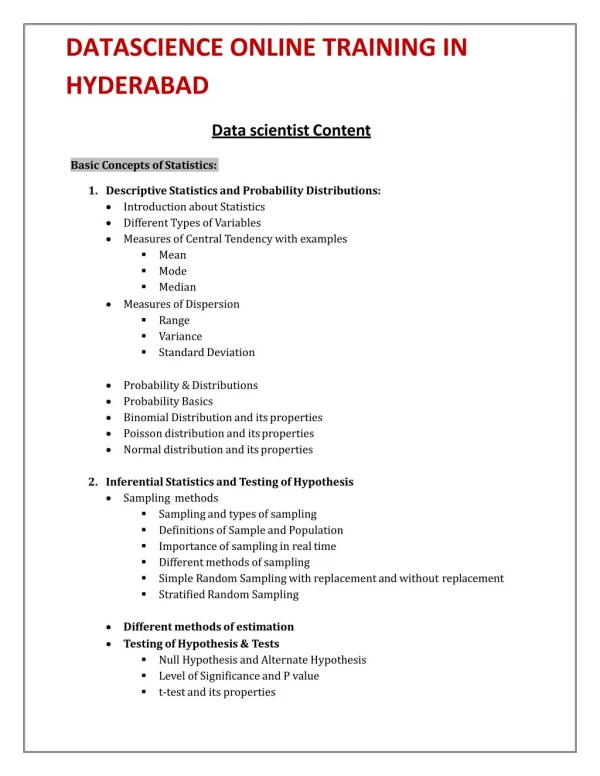
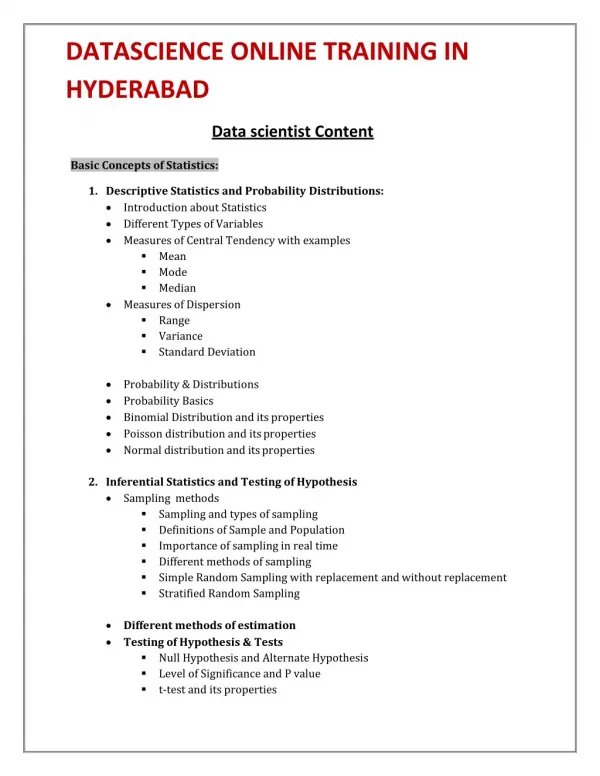
DATASCIENCE ONLINE TRAINING IN HYDERABAD Data scientist Content Basic Concepts of Statistics: 1.Descriptive Statistics and Probability Distributions: Introduction about Statistics Different Types of Variables Measures of Central Tendency with examples Mean Mode Median Measures of Dispersion Range Variance Standard Deviation Probability & Distributions Probability Basics Binomial Distribution and its properties Poisson distribution and its properties Normal distribution and its properties 2.Inferential Statistics and Testing of Hypothesis Sampling methods Sampling and types of sampling Definitions of Sample and Population Importance of sampling in real time Different methods of sampling Simple Random Sampling with replacement and without replacement Stratified Random Sampling Different methods of estimation Testing of Hypothesis & Tests Null Hypothesis and Alternate Hypothesis Level of Significance and P value t-test and its properties
Chi-square test and it’s properties Z test Analysis of Variance F-test One and Two way ANOVA 3.Covariance & Correlation Importance and Properties of Correlation Types of Correlation with examples Predictive Modeling Steps and Methodology with Live example: Data Preparation Variable Selection Transformation of the variables Normalization of the variables Exploratory Data analysis Summary Statistics Understanding the patterns of the data at single and multiple dimensions Missing data treatment using different methods Outlier’s identification and treating outliers Visualization of the data using the One Dimensional, Two Dimensional and Multi Dimensional Graphs. Bar chart, Histogram, Box plot, Scatter plot, Bubble chart, Word cloud etc… Model Development Selection of the sample data Selecting the appropriate model based on the requirement and data availability Model Validation Model Implementation Key Statistical parameters checking Validating the model results with the actual result Model Implementation Implementing the model for future prediction Real time telecom business use case with detail explanation Introducing couple of real time use cases and solutions of Banking and Retail domains using the different statistical methods. Supervised Techniques:
Multiple linear Regression Linear Regression - Introduction - Applications Assumptions of Linear Regression Building Linear Regression Model Understanding standard metrics (Variable significance, R-square/Adjusted R-Square, Global hypothesis etc) Validation of Linear Regression Models (Re running Vs. Scoring) Standard Business Outputs (Decile Analysis, Error distribution (histogram), Model equation, drivers etc) Interpretation of Results - Business Validation - Implementation on new data Real time case study of Manufacturing and Telecom Industry to estimate the future revenue using the models Logistic Regression Logistic Regression - Introduction - Applications Linear Regression Vs. Logistic Regression Vs. Generalized Linear Models Building Logistic Regression Model Understanding standard model metrics (Concordance, Variable significance, Hosmer Lemeshov Test, Gini, KS, Misclassification etc) Validation of Logistic Regression Models (Re running Vs. Scoring) Standard Business Outputs (Decile Analysis, ROC Curve) Probability Cut-offs, Lift charts, Model equation, drivers etc) Interpretation of Results - Business Validation - Implementation on new data Real time case study to Predict the Churn customers in the Banking and Retail industry Partial Least Square Regression Partial Least square Regression - Introduction - Applications Difference between Linear Regression and Partial Least Square Regression Building PLS Model Understanding standard metrics (Variable significance, R-square/Adjusted R-Square, Global hypothesis etc) Interpretation of Results - Business Validation - Implementation on new data Sharing the real time example to identify the key factors which are driving the Revenue Variable Reduction Techniques Factor Analysis Principle component analysis Assumptions of PCA Working Mechanism of PCA
Types of Rotations Standardization Positives and Negatives of PCA Supervised Techniques Classification: CHAID CART Difference between CHAID and CART Random Forest Decision tree vs. Random Forest Data Preparation Missing data imputation Outlier detection Handling imbalance data Random Record selection Random Forest R parameters Random Variable selection Optimal number of variables selection Calculating Out Of Bag (OOB) error rate Calculating Out of Bag Predictions Couple of Real time use cases which are related to Telecom and Retail Industry. Identification of the Churn. Unsupervised Techniques: Segmentation for Marketing Analysis Need for segmentation Criterion of segmentation Types of distances Clustering algorithms Hierarchical clustering K-means clustering Deciding number of clusters Case study Business Rules Criteria Real time use case to identify the Most Valuable revenue generating Customers. Time series Analysis: Forecasting - Introduction - Applications
Time Series Components( Trend, Seasonality, Cyclicity and Level) and Decomposition Basic Techniques – Averages, Smoothening etc Advanced Techniques AR Models, ARIMA UCM Hybrid Model Understanding Forecasting Accuracy - MAPE, MAD, MSE etc Couple of use cases, To forecast the future sales of products Text Analytics: Gathering text data from web and other sources Processing raw web data Collecting twitter data with Twitter API Naive Bayes Algorithm Assumptions and of Naïve Bayes Processing of Text data Handling Standard and Text data Building Naïve Bayes Model Understanding standard model metrics Validation of the Models (Re running Vs. Scoring) Sentiment analysis Goal Setting Text Preprocessing Parsing the content Text refinement Analysis and Scoring Use case of Health care industry, To identify the sentiment of the patients on Specified hospital by extracting the data from the TWITTER. Visualization Using Tableau: Live connectivity from R to Tableau Generating the Reports and Charts
R PROGRAMMING SESSION 1: Getting Started with R What is statistical programming? The R package Installation of R The R command line Function calls, symbols, and assignment Packages Getting help on R Basic features of R Calculating with R SESSION 2: Matrices, Array, Lists, and Data Frames Character vectors Operations on the logical vectors Creating the matrices and operations on it Creating the array and operations on it Creating the lists and operations on it Making data frames Working with data frames SESSION3: Getting Data in and out of R Importing Data into R Exporting Data in R Copy Data from Excel to R Loading and Saving Data with R Importing different types of file formats SESSION4: Data Manipulation and Exploration: Variable transformations Creating Dummy variables Data set options (Rename, Label) Keep / Drop Columns Identification and Dealing with the Missing data Sorting the data Handling the Duplicates Joining and Merging (Inner,Left,Right and Cross Join) Calculating Descriptive Statistics Summarize numeric variables Summarize factor variables Transpose Data Aggregated functions using Group by dplyr anddatatable packages for the data manipulation
Data preparation using the sqldf package SESSION5: Conditional Statements and Loops: If Else Nested If Else For Loop While Loop SESSION6: Functions: Character Functions Numeric Functions Apply Function on Rows Converting a factor to integer Indexing Operators in List SESSION7: Graphical procedures Pie chart Bar Chart Box plot Scatter plot Multi Scatter plot Word cloud etc.… SESSION8: Advanced R and Real time analytics examples: Data extraction from the Twitter Text Data handling Positive and Negative word cloud Required packages for the analytics Sentiment analysis using the real time example R code automation Time series analysis with the real time Telecom data Couple of examples with the time series data <a herf =”http://airistrainings.com/data-scienceonline-training-hyderbad.php”>Datascience online training in Hyderabad</a> <a href=”http://airistrainings.com/data-scienceonline-training-hyderbad.php”>Best datascience online training in Hyderabad</a>