Download
1 / 43
430 likes | 572 Views
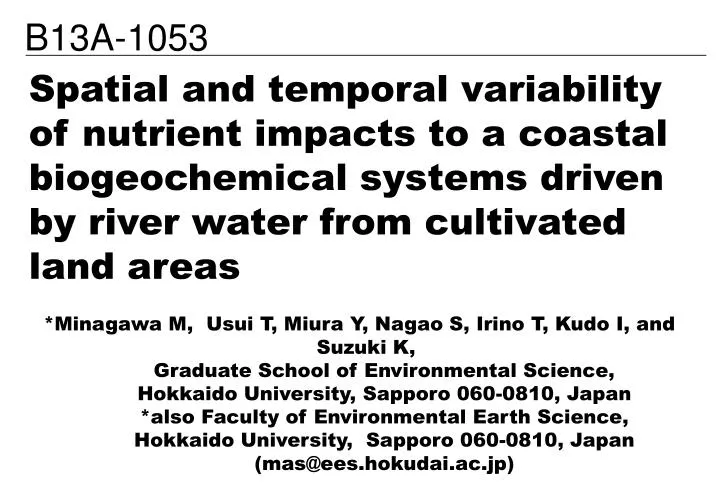
B13A-1053. Spatial and temporal variability of nutrient impacts to a coastal biogeochemical systems driven by river water from cultivated land areas. *Minagawa M, Usui T, Miura Y, Nagao S, Irino T, Kudo I, and Suzuki K,

E N D
B13A-1053 Spatial and temporal variability of nutrient impacts to a coastal biogeochemical systems driven by river water from cultivated land areas *Minagawa M, Usui T, Miura Y, Nagao S, Irino T, Kudo I, and Suzuki K, Graduate School of Environmental Science, Hokkaido University, Sapporo 060-0810, Japan *also Faculty of Environmental Earth Science, Hokkaido University, Sapporo 060-0810, Japan (mas@ees.hokudai.ac.jp)
Objectives • to estimate nutrient impact from Tokachi river to the coastal water • to evaluate origin of carbon and nitrogen of POM off Tokachi coast • to elucidate loading pattern of riverine substances from cultivated land • to estimate influence of nutrient impact to coastal production Tokachi river Flood discharge: 15200 m3/sec Catchment area: 9010 Km2 Population: 358000 (density= 34 /Km2)
42.8°N 42.6°N 1000 m 42.4°N 100 m 500 m 200 m 42.2°N 143.6°E 144°E 144.4°E Sampling location Tokachi River ▲ ▲ Tokachi River ● Sapporo North Pacific North Pacific Observation and Samples ● Stations off Tokachi (Hydrographic, Nutrients, POM, traps & sediments ) May, August and Nov. 2003 / April, May, July, Nov. and Dec. 2004 / March 2005 ▲ River stations (Hydrographic, nutrients, POM, Sediments) from May 2003 to Sept. 2005 Analyses: temperature, salinity, NO3, NO2, NH4, Si, P, chlorophyll a, POC, PON δ13C of POC and δ15N of PN in river water and seawater
Sea surface salinity off Tokachi Tokachi River Tokachi River 42.8°N 42.8°N 42.6°N 42.6°N 1000 m 1000 m 42.4°N 42.4°N 100 m 100 m 500 m 500 m 200 m 200 m 42.2°N 42.2°N 34 34 143.6°E 144°E 144.4°E 143.6°E 144°E 144.4°E 33 33 32 32 31 31 30 30 29 29 28 28 Tokachi River 42.8°N 42.6°N 1000 m 42.4°N 100 m 500 m 200 m 42.2°N 143.6°E 144°E 144.4°E August 2003 Nov. 2003 May 2003
600 600 600 400 400 400 200 200 200 0 0 0 Tokachi River (Discharge) 2003 August 10: 4634 m3/s Main water sources: Spring-Summer: Snow-melt water Summer-Autumn: Rainfall River discharge (m3/s) J F M A M J J A S O N D Month ●River water sampling ■Seawater sampling 2004 2005 Sept. 8: 2072 m3/s River discharge (m3/s) River discharge (m3/s) J F M A M J J A S O N D Month J F M A M J J A S O N D Month
Vertical profile of Salinity Tokachi River 42.8°N 42.6°N 1000 m 42.4°N 100 m Salinity Salinity Salinity 500 m 200 m 28 30 32 34 28 30 32 34 28 30 32 34 42.2°N 34 0 0 0 143.6°E 144°E 144.4°E 33 10 10 10 32 31 20 20 20 Depth (m) Depth (m) Depth (m) 30 30 30 30 29 40 40 40 28 50 50 50 St.T31 ■ St.T33 St.T35 May 2003 August 2003 Nov. 2003 May 2003 ◆ ◆St.T31: river mouth ■St.T33: in plume ▲St.T35: Outside of the plume ▲
Water quality of the Tokachi River 250 -16 8 500 200 4 400 -20 0 150 300 -24 100 -4 200 -28 -8 50 100 -12 -32 0 0 NO3- + NO2- (μM) POC (μM) Sept. 8, 2005: 2430 μM ■ 2003 ● 2004 ▲2005 ▲ POC (μM) NO3- + NO2- (μM) Surface seawater Surface seawater J F M A M J J A S O N D Month J F M A M J J A S O N D Month δ13C of POC (‰) δ15N of PN (‰) Surface seawater δ15N (‰) δ13C (‰) Surface seawater ■ 2003 ● 2004 ▲2005 J F M A M J J A S O N D Month J F M A M J J A S O N D Month
Seasonal changes at Stn.T35, outside of the river plume Nitrate + nitrite at 0 m depth Phosphate at 0 m depth 1.5 60 15 15 10 1 40 10 ■ 2003 ● 2004 ▲2005 NO3- + NO2- (μM) PO43- (μM) 5 20 0.5 5 0 0 0 0 J F M A M J J A S O N D J F M A M J J A S O N D Month Month Chl.a at 0 m depth POC at 0 m depth POC (μM) Chl.a (μg/l) J F M A M J J A S O N D J F M A M J J A S O N D Month Month
-15 8 15 80 60 6 60 -20 10 40 40 4 -25 5 20 20 2 0 0 -30 0 0 28 30 32 34 -20 28 30 32 34 32 34 34 28 28 28 30 30 30 32 32 34 Chl.a, POC and isotope ratios vs. Salinity May, August, November, 2003 Chl.a POC ◆May◆August◆November POC (μM) Chl.a (μg/l) Salinity Salinity Fraction of riverine POC estimated by δ13C δ13C of POC δ15N of PN River POC fraction (%) δ13C-POC (‰) δ15N-PN (‰) River PN River POC Salinity Salinity Salinity
13C of surface sediments and POC 13C δ13C (‰) St.T35 POC(May) 43°N Tokachi River -19 St.T31× Surface Sediments -20 -20 ×St.T33 -21 St.T33 POC(May) ×St.T35 -22 -21 -23 -24 St.T31(0-5m) POC(May) -25 42°N -22 1000m 200m -26 2000m -27 0 500 1000 1500 2000 Water depth (m) 144°E 145°E -23 Surface sediments record 13C pattern indicating terrestrial organic carbon. Rapid dilution by marine organic carbon take places on the shelf and most parts of organic carbon are replaced by marine origin toward pelagic (> 200m depth). -24 -25
13C and d15N of soil, POM and sediments River POM (sinking POM) might supply more than 40 % organic CN sources of coastal sediments in the Tokachi shelf (<200m)
Conclusions ・River water plays an important role for supplying significant amount of nutrients and POM on the shelf off Tokachi (water depth<200 m) ・Discharge by snow-melting (in early summer) and heavy rain (in summer and autumn) conveys nutrients to support major production at the coastal area in summer ・Blooming in spring and autumn are supported by nutrients in the pelagic subsurface seawater (Oyashio current) ・Annual load of DIN, PO43-, Si(OH)4 and POC from the Tokachi River to the coastal waters is corresponding to 37, 3.3, 145 and 7.3% of primary production reported in the Oyashio Water, respectively. References: Usui T. et al. (2006) Distribution and sources of organic matter in surficial sediments on the shelf and slope off Tokachi, western North Pacific, inferred from C and N stable isotopes and C/N ratios, Marine Chemistry 98, 241–259
Tokachi River (Discharge) 2003 August 10: 4634 m3/s 600 600 600 River discharge (m3/s) ●River water sampling ■Seawater sampling 400 400 400 200 200 200 0 0 0 J F M A M J J A S O N D Month 2004 2005 Sept. 8: 2072 m3/s River discharge (m3/s) River discharge (m3/s) J F M A M J J A S O N D Month J F M A M J J A S O N D Month
Sea surface salinity off Tokachi Tokachi River Tokachi River Tokachi River 42.8°N 42.8°N 42.8°N May 2003 42.6°N 42.6°N 42.6°N 1000 m 1000 m 1000 m 42.4°N 42.4°N 42.4°N 100 m 100 m 100 m 500 m 500 m 500 m 200 m 200 m 200 m 42.2°N 42.2°N 42.2°N 34 34 34 143.6°E 143.6°E 143.6°E 144°E 144°E 144°E 144.4°E 144.4°E 144.4°E 33 33 33 32 32 32 31 31 31 30 30 30 29 29 29 28 28 28 August 2003 Nov. 2003
Vertical salinityprofiles off Tokachi Tokachi River 42.8°N 42.6°N May 2003 1000 m St.T31 42.4°N ◆ 100 m ◆St.T31: Nearest to the river mouth ■St.T33 ▲St.T35: Outside of the plume Salinity Salinity Salinity 500 m 200 m 28 30 32 34 28 30 32 34 28 30 32 34 42.2°N ■ 34 0 0 0 143.6°E 144°E 144.4°E 33 10 10 10 32 St.T33 ▲ 31 20 20 20 Depth (m) Depth (m) Depth (m) St.T35 30 30 30 30 29 40 40 40 28 50 50 50 May 2003 August 2003 Nov. 2003
Seasonal changes at Stn.T35, outside of the river plume Tokachi River 42.8°N 42.6°N 1000 m 42.4°N 24 25 26 27 100 m 500 m 0 200 m 42.2°N 34 143.6°E 144°E 144.4°E 33 20 32 31 40 30 29 60 28 80 Density (σθ) profile Nov. May 2003 May August Depth (m) ▲ St.T35 Dec.
Salinity vs. nitrate and Chl.a in surface water off Tokachi 20 20 20 15 15 15 10 10 10 5 5 5 0 0 0 28 30 32 34 28 30 32 34 28 30 32 34 Nov. NO3- May NO3- August NO3- NO3- + NO2- (μM) NO3- + NO2- (μM) NO3- + NO2- (μM) Salinity Salinity Salinity ―: Theoretical mixing line between river and offshore waters
Salinity vs. nitrate and Chl.a in surface water off Tokachi 20 20 20 20 20 20 15 15 15 15 15 15 10 10 10 10 10 10 5 5 5 5 5 5 0 0 0 0 0 0 28 30 32 34 28 30 32 34 28 28 30 30 32 32 34 34 28 28 30 30 32 32 34 34 May NO3- August NO3- Nov. NO3- NO3- + NO2- (μM) NO3- + NO2- (μM) NO3- + NO2- (μM) Salinity Salinity Salinity May Chl.a ◇: Chl.a calculated by (Theoretical NO3-) – (actual NO3-) August Chl.a Nov. Chl.a Chl.a (μg/l) Chl.a (μg/l) Chl.a (μg/l) Salinity Salinity Salinity
Salinity vs. Chl.a, POC and isotope ratios in surface water off Tokachi in May 2003 15 10 -15 8 60 5 6 -20 40 0 4 -25 28 30 32 34 20 2 0 -30 0 28 30 32 34 28 28 30 30 32 32 34 34 Chl.a POC POC (μM) Chl.a (μg/l) Salinity Salinity δ13C of POC δ15N of PN δ15N-PN (‰) δ13C-POC (‰) River PN River POC Salinity Salinity
Salinity vs. Chl.a, POC and isotope ratios in surface water off Tokachi in May 2003 15 10 -15 8 60 5 6 -20 40 0 4 -25 28 30 32 34 20 2 0 -30 0 28 30 32 34 28 28 30 30 32 32 34 34 Chl.a POC POC (μM) Chl.a (μg/l) Salinity Salinity δ13C of POC δ15N of PN δ15N-PN (‰) δ13C-POC (‰) Offshore River Salinity Salinity
Chl.a, POC and isotope ratios via Sal May 2003 Chl.a POC 15 60 POC (μM) Chl.a (μg/l) 10 40 5 20 0 0 Fraction of riverine POC estimated by δ13C 28 30 32 34 28 30 32 34 Salinity Salinity δ13C of POC δ15N of PN -15 8 80 δ15N-PN (‰) 6 60 River POC fraction (%) δ13C-POC (‰) -20 40 4 20 -25 2 0 28 30 32 34 -30 0 -20 28 30 32 34 28 30 32 34 River POC Salinity Salinity Salinity
Chl.a, POC and isotope ratios via Sal November 2003 Chl.a POC 15 60 POC (μM) Chl.a (μg/l) 10 40 5 20 0 0 Fraction of riverine POC estimated by δ13C 28 30 32 34 28 30 32 34 Salinity Salinity δ13C of POC δ15N of PN 8 -15 80 60 6 River POC fraction (%) δ15N-PN (‰) δ13C-POC (‰) -20 40 4 20 -25 2 River PN 0 28 30 32 34 -30 0 -20 28 30 32 34 28 30 32 34 Salinity Salinity Salinity River POC
Chl.a, POC and isotope ratios via Sal May 2003 15 10 -15 8 60 5 6 -20 40 0 4 -25 28 30 32 34 20 2 0 -30 0 28 30 32 34 28 28 30 30 32 32 34 34 Chl.a POC POC (μM) Chl.a (μg/l) Fraction of riverine POC estimated by δ13C Salinity Salinity δ13C of POC δ15N of PN 80 δ15N-PN (‰) 60 River POC fraction (%) δ13C-POC (‰) 40 20 0 28 30 32 34 -20 River POC Salinity Salinity Salinity
Chl.a, POC and isotope ratios via Sal August 2003 -15 8 15 80 60 6 60 -20 10 40 40 4 -25 5 20 20 2 0 0 -30 0 0 28 30 32 34 -20 28 30 32 34 28 28 28 30 30 30 32 32 32 34 34 34 Chl.a POC POC (μM) Chl.a (μg/l) Fraction of riverine POC estimated by δ13C Salinity Salinity δ13C of POC δ15N of PN River POC fraction (%) δ13C-POC (‰) δ15N-PN (‰) River PN River POC Salinity Salinity Salinity
Chl.a, POC and isotope ratios via Sal November 2003 15 60 -15 10 8 40 -20 6 5 20 -25 4 0 0 -30 2 28 30 32 34 28 30 32 34 28 30 32 34 0 28 30 32 34 Chl.a POC POC (μM) Chl.a (μg/l) Fraction of riverine POC estimated by δ13C Salinity Salinity δ13C of POC δ15N of PN 80 60 River POC fraction (%) δ15N-PN (‰) δ13C-POC (‰) 40 20 River PN 0 28 30 32 34 -20 Salinity Salinity Salinity River POC
Annual fluxes of nutrient and POC from the Tokachi River to the coastal waters from Oct. 2004 to Sept. 2005 (Riverine flux per surface area of the coastal waters) =(Concentration in the river water)×(River flow)/ (Maximum plume area, observed in May 2003: width of 37 km × length of 28 km from the coast)
Sea surface salinity off Tokachi Tokachi River 42.8°N 42.6°N 1000 m 42.4°N 100 m 500 m 200 m 42.2°N 34 143.6°E 144°E 144.4°E 33 32 31 30 29 28 Maximum plume area, observed in May 2003: width of 37 km × length of 28 km from the coast
Annual fluxes of nutrient and POC from the Tokachi River to the coastal waters from Oct. 2004 to Sept. 2005 (Riverine flux per surface area of the coastal waters) =(Concentration in the river water)×(River flow)/ (Maximum plume area, observed in May 2003: width of 37 km × length of 28 km from the coast) Preliminary estimations in global continental margins by Chen et al. (2004) Riverine DIN input / Primary production: 0.5 – 4.4% Riverine POC input / Primary production: 3.6%
Seasonal changes of density, nitrate and Chl.a at Stn.T35, outside of the river plume 0 5 10 15 0 5 10 15 20 24 25 26 27 0 0 0 20 20 20 40 40 40 60 60 60 80 80 80 100 100 100 Density (σθ) NO3- + NO2- (μM) Chl.a (μg/l) 8月 May 11月 August 11月 5月 Depth (m) Depth (m) Depth (m) 5月 Nov. 8月 ■ May: Spring bloom ● August: Summer stratification ▲Nov.: Fall bloom
Salinity vs. nitrate and Chl.a in surface water off Tokachi 15 20 20 20 10 15 15 15 10 10 10 5 5 5 5 0 0 0 0 28 30 32 34 28 30 32 34 28 30 32 34 28 30 32 34 15 15 10 10 5 5 0 0 28 30 32 34 28 30 32 34 十勝川:90.3μM 十勝川:66.2μM 十勝川:110μM Nov. NO3- May NO3- August NO3- NO3- + NO2- (μM) NO3- + NO2- (μM) NO3- + NO2- (μM) Theoretical mixing line between river and offshore waters Salinity Salinity Salinity May Chl.a August Chl.a Nov. Chl.a Chl.a (μg/l) Chl.a (μg/l) Chl.a (μg/l) Salinity Salinity Salinity
Salinity vs. Chl.a, POC, POC/Chl.a, C/N and isotope ratios in surface water off Tokachi in May 2003 15 300 10 200 -15 8 15 60 5 100 6 -20 40 0 10 4 0 -25 28 30 32 34 28 30 32 34 20 2 5 0 -30 0 28 28 30 30 32 32 34 34 28 28 30 30 32 32 34 34 Chl.a POC POC/Chl.a POC/Chl.a (g/g) POC (μM) Chl.a (μg/l) Salinity Salinity Salinity C/N δ15N δ13C δ15N-PN (‰) C/N (mol/mol) δ13C-POC (‰) Salinity Salinity Salinity
Salinity vs. Chl.a, POC, POC/Chl.a, C/N and isotope ratios in surface water off Tokachi in May 2003 15 300 10 200 -15 8 15 60 5 100 6 -20 40 0 10 4 0 -25 28 30 32 34 28 30 32 34 20 2 5 0 -30 0 28 28 30 30 32 32 34 34 28 28 30 30 32 32 34 34 Chl.a POC POC/Chl.a POC/Chl.a (g/g) POC (μM) Chl.a (μg/l) Salinity Salinity Salinity C/N δ15N δ13C δ15N-PN (‰) C/N (mol/mol) δ13C-POC (‰) Salinity Salinity Salinity
Salinity vs. Chl.a, POC, POC/Chl.a, C/N and isotope ratios in surface water off Tokachi in August 2003 300 200 -15 8 15 60 100 6 -20 10 40 4 0 -25 5 28 30 32 34 20 2 0 -30 0 0 28 30 32 34 28 28 28 30 30 30 32 32 32 34 34 34 15 10 5 28 30 32 34 POC/Chl.a Chl.a POC POC/Chl.a (g/g) POC (μM) Chl.a (μg/l) Salinity Salinity Salinity C/N δ15N δ13C δ15N-PN (‰) C/N (mol/mol) δ13C-POC (‰) Salinity Salinity Salinity
Salinity vs. Chl.a, POC, POC/Chl.a, C/N and isotope ratios in surface water off Tokachi in November 2003 15 300 60 -15 10 200 8 40 -20 6 5 100 20 -25 4 十勝川:581 0 0 0 -30 2 28 30 32 34 28 30 32 34 28 30 32 34 28 30 32 34 0 28 30 32 34 Chl.a POC POC/Chl.a POC/Chl.a (g/g) POC (μM) Chl.a (μg/l) Salinity Salinity Salinity C/N δ15N δ13C δ15N-PN (‰) C/N (mol/mol) δ13C-POC (‰) Salinity Salinity Salinity
栄養塩濃度の鉛直分布(2003年5月) Si(OH)4 (μM) SRP (μM) NO3- + NO2- (μM) 0 20 40 60 0 1 2 0 10 20 0 0 0 20 20 20 40 40 40 Depth (m) Salinity Depth (m) Depth (m) 28 30 32 34 60 60 60 0 80 80 80 20 100 100 100 40 Depth (m) 60 80 100 十勝川:90.3μM ◆St.T31:水深20m ×St.T33:水深85m ○St.T35:水深567m 十勝川: 326μM
Chl.a、POC、PN濃度の鉛直分布(2003年5月) 十勝川 ◆St.T31:水深20m ×St.T33:水深85m ○St.T35:水深567m PN (μM) POC (μM) Chla (μg/l) 0 5 10 0 0 5 50 10 100 15 0 0 0 20 20 20 40 40 40 Depth (m) Salinity Depth (m) Depth (m) 28 30 32 34 60 60 60 0 80 80 80 20 100 100 100 40 Depth (m) 60 80 100
C/N、POC/Chl.a、δ13C、δ15Nの鉛直分布 十勝川 ◆St.T31:水深20m ×St.T33:水深85m ○St.T35:水深567m POC/Chla POC (μM) δ15N-PN Molar C/N δ13C-POC 0 100 200 300 400 0 0 0 5 50 5 10 100 10 15 -30 -25 -20 -15 0 0 0 0 0 20 20 20 20 20 40 40 40 40 40 Depth (m) Depth (m) Depth (m) Depth (m) Depth (m) 60 60 60 60 60 80 80 80 80 80 100 100 100 100 100 2003年5月
十勝沖T35における0-10mのChl.a濃度、NO3-濃度、懸濁態有機炭素・窒素同位体比の季節変化十勝沖T35における0-10mのChl.a濃度、NO3-濃度、懸濁態有機炭素・窒素同位体比の季節変化 15 10 5 0 5 4 3 2 1 0 Chl.a NO3- Chl.a (μg/l) NO3- (μM) 5月 8月 11月 5月 8月 11月 -18 -20 -22 -24 -26 -28 8 7 6 5 4 3 δ15N-PN δ13C-POC δ13C-POC (‰) δ15N-PN (‰) 5月 8月 11月 5月 8月 11月