Download
1 / 1
20 likes | 109 Views
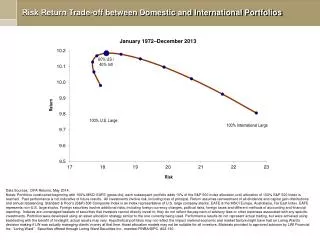
Explore the trade-off between risk and return in domestic and international portfolios based on DFA Returns from May 2014. Learn how portfolios were constructed and the associated risks. Disclaimer: Past performance doesn't guarantee future results. Foreign securities entail additional risks. Portfolios don't reflect actual trading. Asset allocation models may vary. Securities offered by Loring Ward Securities Inc., member FINRA/SIPC.

E N D
Risk Return Trade-off between Domestic and International Portfolios Data Sources: DFA Returns, May 2014. Notes: Portfolios constructed beginning with 100% MSCI EAFE (gross div); each subsequent portfolio adds 10% of the S&P 500 Index allocation until allocation of 100% S&P 500 Index is reached. Past performance is not indicative of future results. All investments involve risk, including loss of principal. Return assumes reinvestment of all dividends and capital gain distributions and annual rebalancing. Standard & Poor’s (S&P) 500 Composite Index is an index representative of U.S. large company stocks. EAFE is the MSCI Europe, Australasia, Far East Index. EAFE represents non-U.S. large stocks. Foreign securities involve additional risks, including foreign currency changes, political risks, foreign taxes and different methods of accounting and financial reporting. Indexes are unmanaged baskets of securities that investors cannot directly invest in; they do not reflect the payment of advisory fees or other expenses associated with any specific investments. Portfolios were developed using an asset allocation strategy similar to the one currently being used. Performance results do not represent actual trading, but were achieved using backtesting with the benefit of hindsight; actual results may vary. Hypothetical portfolios may not reflect the impact material economic and market factors might have had on Loring Ward’s decision making if LW was actually managing clients’ money at that time. Asset allocation models may not be suitable for all investors. Materials provided to approved advisors by LWI Financial Inc. “Loring Ward”. Securities offered through Loring Ward Securities Inc., member FINRA/SIPC. #02-130.