energy input from sun
380 likes | 571 Views
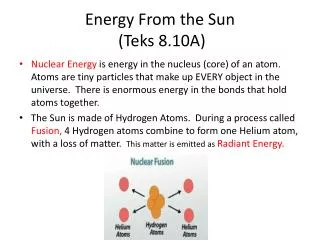
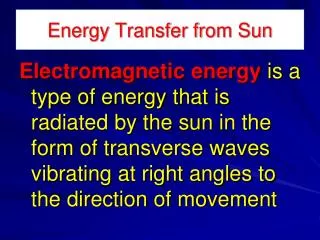
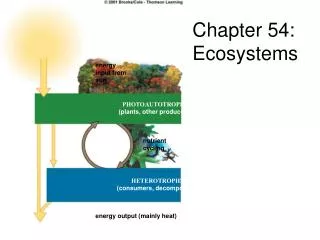
Chapter 54: Ecosystems. energy input from sun. PHOTOAUTOTROPHS (plants, other producers). nutrient cycling. HETEROTROPHS (consumers, decomposers). energy output (mainly heat). Producers. Autotroph: Obtain energy from inorganic sources. Phototrophs (collect energy from sunlight)

energy input from sun
E N D
Presentation Transcript
Chapter 54: Ecosystems energy input from sun PHOTOAUTOTROPHS (plants, other producers) nutrient cycling HETEROTROPHS (consumers, decomposers) energy output (mainly heat)
Producers • Autotroph: Obtain energy from inorganic sources. • Phototrophs (collect energy from sunlight) • Chemotrophs (collect energy from chemicals in their environment)
Consumers • Heterotroph: Obtain energy from organic sources. • Herbivores (feed off plants), • Carnivores (feed off of other consumers), • Omnivores (feed off both consumers and producers), • Decomposers (digest food outside of body), • Detrivores (internally ingest dead and decaying matter)
Trophic (energy) levels Primary Consumer: Feed of producers Secondary Consumer: Feed of 1st level consumer. Tertiary Consumer: Feed off 2nd level and below. Quaternary Consumer: Feed off 3rd level and below.
MARSH HAWK CROW HIGHER TROPHIC LEVELS Complex array of carnivores, omnivores and other consumers. Many feed at more than one trophic level continually, seasonally, or when an oppportunity presents itself UPLAND SANDPIPER GARTER SNAKE FROG WEASEL BADGER COYOTE SPIDER SECOND TROPHIC LEVEL Primary consumers (e.g., herbivores) CLAY-COLORED SPARROW EARTHWORMS, INSECTS (E.G., GRASSHOPPPERS, CUTWORMS) PRAIRIE VOLE POCKET GOPHER GROUND SQUIRREL FIRST TROPHIC LEVEL Primary producers Fig. 49.6, p. 878
Fourth-level consumers (heterotrophs): Top carnivores, parasites, detritivores, decomposers 5th Third-level consumers (heterotrophs): 4th Carnivores, parasites, detritivores, decomposers Second-level consumers (heterotrophs): 3d Carnivores, parasites, detritivores, decomposers First-level consumers (heterotrophs): 2nd Herbivores, parasites, detritivores, decomposers Primary producers (autotrophs): 1st Photoautotrophs, chemoautotrophs Fig. 49.4, p. 877
leopard seal killer whale emperor penguin Weddell seal skua Adelie penguin blue whale fishes, squid petrel krill phytoplankton Fig. 49.27, p. 894
ENERGY INPUT: ENERGY INPUT: ENERGY TRANSFERS: ENERGY TRANSFERS: Producers (photosynthesizers) Producers (photosynthesizers) energy lost at each conversion step from one trophic level to the next energy lost at each conversion step from one trophic level to the next energy in organic wastes, remains energy losses as metabolic heat and as net export from ecosystem energy in organic wastes, remains energy losses as metabolic heat and as net export from ecosystem decomposers herbivores carnivores detritivores energy inputs, outputs also occur between the two food webs decomposers ENERGY OUTPUT ENERGY OUTPUT Fig. 49.7, p. 879
10% Rule On average, only 10% of the energy obtained at one trophic level is transferred to the next trophic level. Where does this energy go?
21 decomposers/detritivores top carnivores carnivores 5,060 383 herbivores 3,368 producers 20,810 Fig. 49.11, p. 882
ENERGY INPUT: 17,000,000 kilocalories incoming solar energy not harnessed: 1,679,190 (98.8%) 20,810 (98.8%) ENERGY TRANSFERS: producers Energy losses as metabolic heat and as net export from the ecosystem: Energy still in organic wastes and remains transferred to the next trophic level: 4,245 3,368 13,197 herbivores 720 383 2,265 carnivores 90 21 272 top carnivores 5 16 decomposers, detritivores 5,060 ENERGY OUPUT: TOTAL ANNUAL ENERGY FLOW: 20,810 + 1,679,190 1,700,000 (100%) Fig. 49.12, p. 882
Biological Magnification Situation in which fat-soluble or indigestible chemicals accumulate in organisms. A concern for animals feeding at higher tropic levels. • Urine is water-based, so doesn’t carry fat-soluble materials out of body. • Case of DDT
DDT Residues (ppm wet weight of whole live organism) Ring-billed gull fledgling (Larus delawarensis Herring gull (Larus argentatus) Osprey (pandion haliaetus) Green heron (Butorides virescens) Atlantic needlefish (Strongylira marina) Summer flounder (Paralychthys dentatus) Sheepshead minnow (Cyprinodon variegatus ) Hard clam (Mercenaria mercenaria) Marsh grass shoots (Spartina patens) Flying insects (mostly flies) Mud snail (Nassarius obsoletus) Shrimps (compsite of several samples) Green alga (Cladophora grcilis) Plankton (mostlky zooplankton) Water 75.5 18.5 13.8 3.57 2.07 1.28 0.94 0.42 0.33 0.30 0.26 0.160.083 0.040 0.00005 Fig. 49.9, p. 880
Respiration How living organisms get energy from ‘burning’ food (usually involves oxygen) Glucose + Oxygen = Carbon Dioxide + Water + Useable Energy
Photosynthesis Process by which autotrophs convert solar energy into useful chemical energy (sugar). Carbon Dioxide + Water = Glucose + Oxygen Process of carbon fixation. (Fix as it making it useful for life)
Productivity Measure of how much glucose/food is made. How broad is the base of the energy pyramid? Factors?
Ecosystem Communities and abiotic factors interacting through energy flow and nutrient cycling. Ecosystem, Habitat, Population, Community
Productivity Gross Primary Productivity, which is the total amount of energy fixed in the process of photosynthesis for an ecosystem Net Primary Productivity is the total amount of energy fixed by photosynthesis minus the amount of energy used by autotrophs in respiration
End World Hunger, and Keep Salix Clean:Understand the Nitrogen Cycle
Define Ironic • 78% of our atmosphere is Nitrogen • Most life on Earth is short of nitrogen • Know nitrification, legume, nitrogen fixation
GASEOUS NITROGEN (N2) IN ATMOSPHERE NITROGEN FIXATION by industry for agriculture FOOD WEBS ON LAND uptake by autotrophs excretion, death, decomposition uptake by autotrophs FERTILIZERS NO3- IN SOIL NITROGEN FIXATION bacteria convert to ammonia (NH3+) ; this dissolves to form ammonium (NH4+) NITROGENOUS WASTES, REMAINS IN SOIL DENTRIFICATION by bacteria 2. NITRIFICATION bacteria convert NO2-tonitrate (NO3-) AMMONIFICATION bacteria, fungi convert the residues to NH3; this dissolves to form NH4+ NH3-,NH4+ IN SOIL 1. NITRIFICATION bacteria convert NH4+ tonitrate (NO2-) NO2- IN SOIL loss by leaching loss by leaching Fig. 49.22, p. 890
Phosphorus Cycle Only sedimentary cycle Usually the limiting factor in aquatic systems.
mining FERTILIZER excretion GUANO agriculture weathering uptake by autotrophs uptake by autotrophs weathering MARINE FOOD WEBS DISSOLVED IN OCEAN WATER DISSOLVED IN SOILWATER, LAKES, RIVERS LAND FOOD WEBS death, decomposition death, decomposition leaching, runoff sedimentation setting out uplifting over geolgic time ROCKS MARINE SEDIMENTS Fig. 49.24, p. 892
Carbon Cycle from Wikipedia
Productivity Gross Primary Productivity, which is the total amount of energy fixed in the process of photosynthesis for an ecosystem Net Primary Productivity is the total amount of energy fixed by photosynthesis minus the amount of energy used by autotrophs in respiration
What influences DO levels? Altitude: Temperature: Movement: Salinity: Plants: Animals/Decay: