Download
1 / 15
150 likes | 297 Views
Humboldt County Economy 2007. Presented to Eureka Old Town Rotary Club November 6, 2007. Humboldt County Economy 2007. By Erick Eschker Department of Economics Humboldt State University Humboldt Economic Index www.humboldt.edu/~indexhum/index.htm. Humboldt Economic Index Sponsors.

E N D
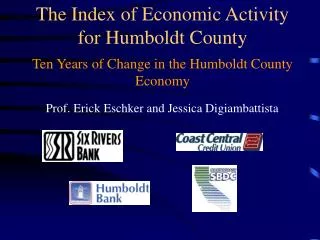
Humboldt County Economy2007 Presented to Eureka Old Town Rotary Club November 6, 2007
Humboldt County Economy2007 By Erick Eschker Department of Economics Humboldt State University Humboldt Economic Index www.humboldt.edu/~indexhum/index.htm
Six Sectors and Composite • Energy • Lumber-based manufacturing • Employment • Hospitality • Retail • Housing • Composite
Energy • Not much has changed in two years
Lumber Manufacturing • Structural Decline but high variability The seasonally adjusted Manufacturing index is represented by the blue area in the graph above. The red line shows the four month moving average which attempts to demonstrate the overall trend in the data with less monthly volatility.
Employment • Very little change in overall employment • Unemployment rate has risen recently
Hospitality • Slight upward trend The seasonally adjusted Hospitality index is represented by the blue area in the graph above. The red line shows the four month moving average which attempts to demonstrate the overall trend in the data with less monthly volatility.
Retail • Based on our own survey (we’re always looking for more data providers!) The seasonally adjusted Retail Index is represented by the blue area in the graph above. The red line shows the four month moving average which attempts to demonstrate the overall trend in the data with less monthly volatility.
Housing • New Real Estate Page on the Index • Significant sales drop since summer 2005 • 40% drop July-Sept (record drop) • Sales now at 1997 levels
House Price to Rent Ratio • Rose very quickly starting in 2003
Composite • Decline since May • Housing and Manufacturing the main reason
Forecast • We don’t do forecasts • Two local Leading Indicators show slowing
Forecast • This is an important time • Recession? Credit Crunch? Inflation? • Federal Reserve Economist on Oct. 22 • Uncertainty: • Financial Markets • Housing • Energy Prices • Consumer Spending