Download
1 / 28
280 likes | 414 Views
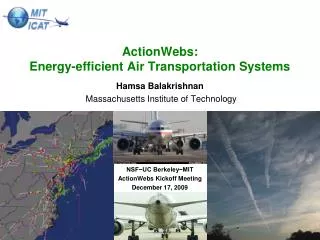
ActionWebs : Energy -efficient Air Transportation Systems. Hamsa Balakrishnan Massachusetts Institute of Technology NSF−UC Berkeley−MIT ActionWebs Kickoff Meeting December 17, 2009. The Air Transportation System. Key player in global travel and commerce

E N D
ActionWebs:Energy-efficient Air Transportation Systems Hamsa Balakrishnan Massachusetts Institute of Technology NSF−UC Berkeley−MIT ActionWebs Kickoff Meeting December 17, 2009
The Air Transportation System • Key player in global travel and commerce • 2 billion passenger enplanements in 2006 (US: ~700 mil.) • 29 million flights worldwide in 2007 (US: ~30,000 flights per day) • Number of flights expected to grow ~2-3x by 2025 • Jet fuel prices are volatile
Air traffic delays • In 2007, domestic air traffic delays cost the US economy $41 billion • 24% of arrivals at least 15 min late (avg. delay: 46 min) • ~20% of total domestic flight time was delay • 1,565 flights delayed on the ground (not at gate) for over 3 hours • 60% rise in rate of passenger complaints (2006-07) • $19 billion in direct operating costs to the airlines • $12 billion cost to passengers Data sources: IATA, FAA ASPM and OPSNET databases, Bureau of Transportation Statistics, Joint Economic Committee, Airline Quality Rating 2008
Air Traffic Management: current functional architecture Weather Capacity schedule Desired traffic loads Airline Operations Center Filed flight plans Approved flight plans/ planned flow rates Clearances/advisories Aircraft state Aircraft Guidance & Navigation Approved handoffs National Flow Planning Facility Flow Planning Facility Traffic Planning Facility Traffic Control Flight Planning Flight schedules < 5 min Hrs-day 5 min 5-20 min Negotiate handoffs Traffic situation Recorded ETMS data Central Flow Mgmt Unit Traffic Mgmt Unit Facility Traffic Manager Airlines Facility ATC Pilot Throughput Efficiency Planning Execution Safety [Adapted from A. Haraldsdottir (Boeing), 1998]
Key research objectives • More decentralized decision-making • More flexible and dynamic trajectories • Increase efficiency of operations • Increase operational robustness in the presence of weather • Decrease fuel burn and environmental impact • Multi-objective control techniques for balancing tradeoffs The use of onboard sensing in ActionWebs, combined with the development of hybrid systems models of aircraft trajectories can help us achieve these objectives
An Eulerian model for distributed feedback control s5|s3 Sector 5 s3|s5 • Network model has two nodes for each sector boundary (one on each sector) • Links correspond to the regions of airspace • Set of queues associated with each node, each containing aircraft currently in that region of the airspace • Aircraft move from one node to another, at rates determined by the flow rates along the links Sector 2 s3|s6 s2|s1 s3|s2 s6 s1|s2 s2|s3 Sector 1 Sector 3 s2|s4 Sector 4 s4|s2 Le Ny and Balakrishnan, ACC 2009]
An Eulerian model for distributed feedback control • At every node, there is a queue corresponding to each destination • Then, we model the dynamics of queue mat node i by: • is the rate allocation on link (i,j) to flow m(control variable) • Putting this together, airport arrivals/departures inflow outflow
Advantages of this framework • Can apply distributed feedback control policies • For example, MaxWeight • Attractive idea, because sector controllers only need to talk to their neighbors (much like today!) • Build model from archived ETMS (surveillance) data Le Ny and Balakrishnan, ACC 2009; Kannan, Harvard BA thesis, 2009]
For example, the airspace surrounding SFO Numbers denote maximum inter-sector handoff rates in aircraft/min
Scheduling with routing No routing (predefined routes): Sector load (# of aircraft) Time (in hrs) Time (in hrs) With routing: (better balanced loads in two routes) Sector load (# of aircraft)
More flexible and dynamic trajectories • Increase efficiency of operations • Increase operational robustness in the presence of weather
Routing using convective weather forecasts • Convective weather has a significant impact on NAS operations, especially in summer • As the time horizon increases, forecast errors increase (especially when we are trying to forecast storm intensity in a 1 km x 1 km pixel) 5 min 30 min
Route flexibility improves accuracy Forecast Actual B
Decrease fuel burn and environmental impact • Multi-objective control techniques for balancing tradeoffs
Environmental impacts of air transportation • Aviation is responsible for 3% of total global carbon emissions • Aircraft contribute about 12% of CO2 emissions from the transportation sector • According to the European Union, international aviation is one the largest growing contributors to CO2 emissions, having increased 87% between 1990 and 2004 • The aviation sector was responsible for 187.5 million metric tons of CO2 emissions in the US in 2007 (about 3% of total emissions) [Commission of the European Communities, 2006; EPA 2007]
Environmental impact of air traffic delays • Air traffic delays have an environmental cost, in addition to the inconvenience to passengers, airline costs and impact on the economy • In 2007, domestic air traffic delays • Cost airlines an additional $1.6 billion in fuel costs • Consumed an additional 740 million gallons of jet fuel • Released an additional 7.1 million tons of CO2 into the atmosphere • Enhancing system capacity and improving efficiency will result in environmental benefits as well [Joint Economic Committee of the US Senate, 2008]
Surface emissions from taxiing aircraft • In 2007, aircraft in the US spent over 63 million minutes taxiing in to their gates, and over 150 million minutes taxiing out to their runways • An estimated 6 million tons of CO2, 45,000 tons of CO, 8,000 tons of NOx and 4,000 tons of hydrocarbons are emitted annually by aircraft taxiing out for departure • These flights burn fuel and contribute to emissions at low altitudes, and adversely impact local air quality • Taxi-out emissions correspond to about 5% of the fuel burn and emissions from aircraft operations • How do we optimize surface traffic movement to reduce aircraft emissions from taxi processes? [FAA ASPM database; Balakrishnan et al. 2008]
Effect of stopping and starting while taxiing • Potential fuel burn impact from stopping on the surface No significant impact
Effect of stopping and starting while taxiing • Impact depends on pilot actions No significant change in throttle setting
Using CFDR data to estimate impact of different taxi profiles • ICAO emissions databank assumes that aircraft taxi at a constant throttle setting of 7% • Using CFDR data (from Swiss Air) corresponding to taxi profiles of various aircraft, we • Developed a regression model for fuel burn, that considers the baseline fuel burn and the impact of stop-start events • Stop-start impact: Estimate of the form “The extra fuel burn from a start-stop event is equivalent to x additional minutes of taxi time” • Developed a (linear) regression model between fuel burn and throttle settings • Conducted above analysis for 9 aircraft types Fuel burn = Baseline fuel burn rate*(taxi time) + (Stop-start impact)*(# of stop-start events)
CFDR vs. ICAO fuel burn estimates Labels indicate throttle settings Impact of a stop-start event
Minimizing fuel burn impacts of aircraft trajectories Surface surveillance Surface surveillance Flight data recorder Flight data recorder (archival data) Identification of hybrid system model of taxi trajectory Identification of fuel burn model Multi-objective control of taxi trajectories (real-time data)
Multiple real-world objectives • Maximize throughput • Minimize average delay • Minimize maximum delay • Maximize robustness • Minimize fuel consumption • Minimize fuel costs • Minimize operating costs • Minimize passenger delays • Multiple stakeholders with differing objectives, tradeoffs involved [Balakrishnan and Chandran, Operations Research, to appear; Lee and Balakrishnan, Proceedings of the IEEE, 2008]
Summary • ActionWebs concepts can help achieve • More decentralized decision-making • More flexible and dynamic trajectories • Increased efficiency of operations • Increased operational robustness in the presence of weather • Decreased fuel burn and environmental impact • The Air Transportation System test bed will be an exciting application of these concepts!