Download
1 / 1
Comparative Analysis of UCP-1 and 18S Gene Expression through Densitometric OD Data
10 likes | 128 Views
Explore the relationship between UCP-1 and 18S genes using densitometric OD data. The O.D. data comparison reveals insights into gene expression levels. Sample size of 8 with various diets evaluated.
Download Presentation 
Comparative Analysis of UCP-1 and 18S Gene Expression through Densitometric OD Data
An Image/Link below is provided (as is) to download presentation
Download Policy: Content on the Website is provided to you AS IS for your information and personal use and may not be sold / licensed / shared on other websites without getting consent from its author.
Content is provided to you AS IS for your information and personal use only.
Download presentation by click this link.
While downloading, if for some reason you are not able to download a presentation, the publisher may have deleted the file from their server.
During download, if you can't get a presentation, the file might be deleted by the publisher.
E N D
Presentation Transcript
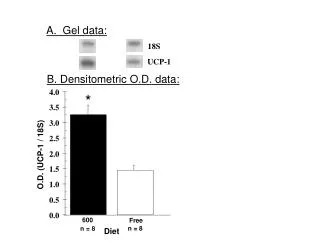
A. Gel data: 18S UCP-1 B. Densitometric O.D. data: 4.0 * 3.5 3.0 O.D. (UCP-1 / 18S) 2.5 2.0 1.5 1.0 0.5 0.0 600 Free n = 8 n = 8 Diet
More Related