Download
1 / 23
230 likes | 405 Views
CL&P Distribution Capital Investment Program. Resource Allocation Under Constraints. UCONN Graduate Business Studies Program Operations Management April 24, 2008 Mike Waggoner CL&P Distribution Asset Management (860) 280-2333. CL&P Capital Program Agenda for Today.

E N D
CL&P Distribution Capital Investment Program Resource Allocation Under Constraints UCONN Graduate Business Studies Program Operations Management April 24, 2008 Mike Waggoner CL&P Distribution Asset Management (860) 280-2333
CL&P Capital ProgramAgenda for Today • Capital Program Decision Making • Capital Needs, Framework & Planning Horizon • Capital Investment Decision Making • Strategic 5 Year Process • Resource Constraints & Cost Drivers • Reliability Improvement Optimization • Review of Reliability Indices (Background) • Reliability Investment Examples • Optimizing Investments • Summary
CL&P Capital ProgramInvestment Framework – Four Focus Areas • Run the Business – Minimum (Mandatory) • Replace Failed Equipment • Highway/Road Relocations • Meters & Transformers (pre-capitalized when purchased) • New Business & Growth (Mandatory) • New Services, Load Relief (Normal Overloads) • Improve the Business (Mandatory & Discretionary) • Load Relief (for Contingency transfers) • Reliability & Obsolescence • Regulatory Requirements • Facilities, Tools, Equipment, etc. • Information Technology (Discretionary)
Run the Business-Minimum Relocations, Equipment Failures, Meters New Business/Growth New Services, Lighting, Load Growth Information Technology Major Hardware Systems (CSI, Work Management ) & routine hardware upgrades Improve the business Hazard Reduction, Regulatory commitments, Reliability improvement and Risk Mitigation Capital Program Framework AREA OF FOCUS MAJOR PROGRAMS (some program examples) Categories used to communicate capital expenditures to regulators and to identify investments in strategic 5 year plan Equipment Failure- Replace (S/S Cap & Pin, UG Sec…) New Service (Indiv customers, new R/C&I developments…) Regulatory Commitments (i.e. TDRP, AB Chance C.O.s,Hi/Low…) Acute Reliability Problems (i.e. CableCure., DR Annual,…) INDIVIDUAL PROJECTS Circuits and Geography drive Individual Projects Annual (<$50k ea.) Smaller recurring /emergent work – completed soon after initiated Specific (=/>$50k) Larger focused efforts that require planning and address a need or initiative
CL&P Capital ProgramFive Year Forecast (Timing) • Current Year – Actively Managed Projects • “Annual” Projects (< $50K each) done as needs emerge • “Specific” Projects (>/= $50K each) constructed as planned • 90% planned and approved 1+ year(s) prior to construction • Review and update 5 year plan • 1-2 Years Ahead • Planning • Engineering for Specific Projects • Justification documented • Alternatives evaluated • Project Review & Approval • Resource Allocation (order major materials, forecast funding changes) • 3-5 years Ahead • Forecast Resource Needs • Planning, Siting, Preliminary Engineering
5 Year Capital Forecast Major Programs typically have several sub-programs or initiatives Capital Needs Growing Significantly. Recent Rate Case extends recovery only thru June 2009
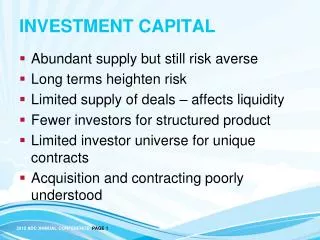
CL&P Capital ProgramResource Constraints • Rates • Amount of capital is either approved in rates, or ‘carried’ until the next rate case • Allowed Rate of Return • Sets maximum earning level on investment • Ratepayers share over-earnings • Not guaranteed • Competes with other investment opportunities w/in NU Business (e.g. – CL&P vs. Transmission or other Operating Cos.) • Franchise Commitments • Increasing mandatory and regulatory requirement spending reduces discretionary investment opportunities • Increasing Costs • Amount of work completed for fixed program amount is reduced
CL&P Capital ProgramCost Drivers • Material Costs Increasing • Global Demand driving raw material costs • Skilled Labor Shortages • Qualified craft workers in demand across industry, short supply, takes years to train and qualify for HV work • Tree Trimmers (many from outside U.S.) • Power Engineers (few schools teach Power Eng. anymore) • Rebuild/Replace Energized Systems • Initial installation done ‘dead’, much less expensive • Very labor intensive to work on high voltage systems – specialized tools and methods required to ‘keep the lights on’ during const. • Traffic Control • State/Municipal Police, Railroad flagman requirements ($60+/hour) • Regulations, Siting, Permitting (CEAB, DOE Xfmr. Eff. Reqmts.)
CL&P Capital ProgramCost Containment Efforts • Long term material forecasts are provided to suppliers • Suppliers help manage inventory (JIT delivery) • Work Clearances – combine efforts when possible • Private Traffic Control where allowed (vs. State/Town PD) • Competitive labor contracts, by project (low bid, NTX,…)
Strategic Capital Decision Making Process –Major Program Level Trustee Approves Capital Program CL&P Officers Approve 2 year Capital Program Ties in with Business Planning Process 5 year Strategic Plan Developed ( Major Program Examples: Regulatory Commitments, Reliability) • Basis for Major Program Development • Rate Case • CL&P strategy • Growth Forecast • Reliability Performance • Cost Expectations Approval by CL&P Officers/ Management Committee (June) Program Development team Allocation of major program dollars based on current impact of drivers • 2 year Capital program Finalized (October) • Categorized by Major Program Drivers: • New Service Growth • Equipment Failure History • Safety Hazards • DPUC commitments • Risk Mitigation • System Performance • Customer Satisfaction Submitted to DPUC (Formal Docket Req) Ties in with Tactical Process
Reliability Improvement Optimization Background - Review of Reliability Indices Reliability Analysis Examples of Alternative Improvement Options
Electric System ReliabilityPerformance Metrics (Background) • Electric Industry Reliability Indices (Annual) • SAIDI = System Average Interruption Duration Index • CAIDI = Customer Average Interruption Duration Index • SAIFI = System Average Interruption Frequency Index • Definitions • SAIDI – average interruption duration in minutes per customer served. • SAIDI = ∑ Customer Minutes = CAIDI * SAIFI Total # Customers Served • CAIDI – average service restoration time (minutes) • CAIDI = ∑ Customer Interruption Durations Total # Customers Interrupted • SAIFI – average number of times a customer is interrupted during a year (# inter) • SAIFI = Total # Customers Interrupted Total # Customers Served • Industry focus is on non-storm SAIDI(major storm interruptions excluded) • 2007 CL&P non-storm performance (CT DPUC Criteria): SAIDI = 120.8 Min CAIDI = 124.9 Min. SAIFI = 0.984 Interruptions
Reliability Improvement Analysis • Interruption Analysis by Circuit or Device completed using past performance • Average annual Customer Minutes Interrupted (CM) = # Customers Interrupted * Minutes Interrupted (annual average calculated based on prior 4 year history) • Improvement Options evaluated for Cost and Impact • Unit Cost Estimates prepared • Reliability impact guidelines exist for most improvement types (% improvement predicted = % of Customer Minutes Saved - CMS) • Outage history analysis is used with the estimated improvement cost and predicted impact to calculate a “Cost per Customer Minute Saved” ($CCMS) value
CL&P Capital ProgramInvestment Optimization • Capital reliability improvement investments are optimized using one or more effectiveness criteria: • Cost per Customer Minute Saved ($CCMS) • Compare various options on a given circuit or device • Provides ‘bar’ from which to judge options across system • SAIDI Impact (CL&P System Level) • Measures impact on system goals • Cost per Interruption Saved ($CIS) • Focused on O&M savings • Examples will help illustrate
Example 1Problem: Tree Caused Outages on Bare WireProposed Solution: Reconductor with Tree Wire Analysis: # Customers on device = 1,000 Length of Overhead Dist. Line = 2.0 miles Average # outages/year = 4 Average outage time = 150 minutes Annual Customer Minutes = 1,000 * 4 * 150 = 600,000 CM Cost to reconductor Line w/ Tree Wire (Improvement) = $500,000/mile Predicted Improvement Impact = 30% Calculated Cost Effectiveness of Reconductoring this Line ($CCMS): = 2.0 mile * $500,000/mi. = $5.56 CCMS 0.30 * 600,000 CM Calculated Impact on CL&P System SAIDI = 0.30 * 600,000 CM = 0.15 Minute of CL&P SAIDI 1.2M Customers (total CL&P)
Example 2 (same circuit, alternate solution)Problem: Tree Caused Outages on Bare WireProposed Solution: Re-sectionalize circuit using reclosers (auto-loop) Analysis: # Customers on device = 1,000 Length of Overhead Dist. Line = 2.0 miles Average # outages/year = 4 Average outage time = 150 minutes Annual Customer Minutes = 1,000 * 4 * 150 = 600,000 CM Cost to sectionalize (install two reclosers) = 2 * $60K ea. = $120,000 Predicted Improvement Impact = 50% (place recloser at customer half-way point, resulting in 500 customers in each of two zones, vs. 1,000 customers in one zone) Calculated Cost Effectiveness of Re-sectionalizing Circuit ($CCMS): = 2 * $60,000 = $0.40 CCMS 0.50 * 600,000 CM Calculated Impact on CL&P System SAIDI = 0.50 * 600,000 CM = 0.250 Minute of CL&P SAIDI 1.2M Customers
Example 1 - Reconductor Cost = $1,000,000 CMS = 180,000 CCMS = $5.56 SAIDI Impact = 0.15 Min. Example 2 – Auto Sectionalize Cost = $120,000 CMS = 300,000 CCMS = $0.40 SAIDI Impact = 0.250 Min. Investment ComparisonBetween Alternatives • Example 2 investment option is more cost effective than example 1 • based on a lower $CCMS and greater impact on CL&P system SAIDI • Reconductoring (ex. 1) eliminates outages (30% prediction). Re-sectionalizing • (ex. 2) does not eliminate outages, only mitigates by reducing customer count • Application of Cost Effective Analysis • Used to ‘screen’ and prioritize options (e.g. – re-sectionalize before recond.) • Guidelines developed and used as ‘bar’ to judge projects for approval • Once a project is Engineering approved, metrics are used for budget year funding and construction prioritization.
CL&P Reliability InvestmentsLimitations of Optimization Analysis • Reactive vs. Proactive (or Predictive) • Requires past outages to justify investment • History does not always repeat • Customers are inconvenienced with outages and poor reliability • Predictive models are typically focused on a particular construction type or equipment class (age, manufacturer) that has a history of poor performance. • Some equipment types fail infrequently but consequences of failure are severe and to be avoided (e.g. UG network, Substation equipment) • CL&P has capital improvement programs based on known poor performing and vintage equipment types - examples: • Rubber ties on insulators (Circuit Backbone rehab) • Cap and Pin Insulators (Substation Bus rehab) • UG Network Secondary Cable Replacement (UG Obsolescence)
Asset Investment Strategy (AIS)Capital Project Evaluation Model • A separate project evaluation tool, called the “Asset Investment • Strategy” model is also used to evaluate or “score” projects for • comparison and funding decisions. • AIS evaluates projects on four primary attributes • Financial Value • Impact on earnings • Cost confidence of estimate • Operational Improvement • Reliability (SAIDI, SAIFI Impact) • Capacity Improvement (Overload relief) • Strategic Goal Alignment • Company Goals Impact (Safety, Reliability, Environmental,…) • Regulatory/Political Relations • Employee and Public Responsibility • Safety (Employee & Public, Environmental) • A score for each of the four attributes is developed and can be used for comparison to other projects within the same program, across all of CL&P, or across multiple NU Operating companies • Model is only as good as original design and update efforts
Selected Option Identify Major Program Category End of Project Tactical Decision Making – Individual Project Level • Identify Need • New Service Growth • DPUC Commitments • Risk Mitigation • System performance • Customer Satisfaction Analysis Metrics Decision Making Estimates & Cost Benefit Evaluation of Options AIS Model Cost Effectiveness Evaluation Circuit Owner\Engineer Metrics AIS CCMS CIS CL&P SAIDI Design Adequacy • OCRC Review & Preliminary Prioritization • of approved projects for year-2 • (May 1) • AIS MODEL • Resource Levels • Metrics Approve Project Timing Proposal Benefit & Engineering Challenge Project Proposal Reject Certain projects on hold for future considerations OPERATING COMPANY REVIEW COMMITTEE Ties in with Strategic Process OCRC Final Review & Prioritization of Projects for year 2 construction (Oct)-Ties in with Strategic Process Post Construction Effectiveness Review “CONTINUOUS PROCESS”
CL&P Capital ProgramSummary • CL&P utilizes a 5 year capital investment planning and strategic decision making process • A large percentage of capital programs are driven by mandatory franchise commitments (new service, load growth, regulatory reqmts…) • Overall investment levels are constrained by DPUC approved rates and allowed Rate of Return (ROE) • The cost to replace existing plant is much higher than original installation, driven by work on and around energized HV equipment • Capital available for reliability improvement is limited • Reliability investments are optimized using cost effectiveness metrics ($CCMS and impact on SAIDI) using a past history of interruptions • The AIS tool can be used to compare individual projects across a program, operating company or multiple operating companies • The tactical (project) approval process is ongoing and ties back to the overall 5 year strategic planning process by introducing new programs and modifying program funding levels as needs dictate