Download
1 / 16
160 likes | 299 Views
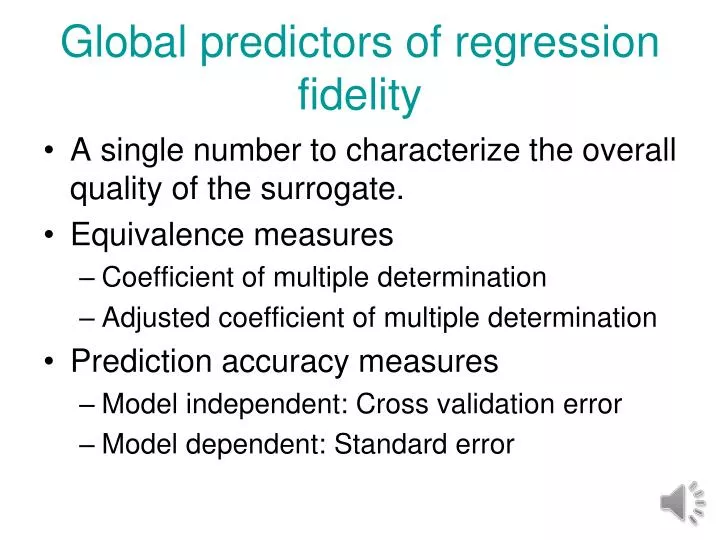
Global predictors of regression fidelity. A single number to characterize the overall quality of the surrogate. Equivalence measures Coefficient of multiple determination Adjusted coefficient of multiple determination Prediction accuracy measures Model independent: Cross validation error

E N D
Global predictors of regression fidelity • A single number to characterize the overall quality of the surrogate. • Equivalence measures • Coefficient of multiple determination • Adjusted coefficient of multiple determination • Prediction accuracy measures • Model independent: Cross validation error • Model dependent: Standard error
Linear Regression • Surrogate is linear combination of given shape functions • For linear approximation • Difference (error) between data and surrogate • Minimize square error • Differentiate to obtain
Coefficient of multiple determination • Equivalence of surrogate with data is often measured by how much of the variance in the data is captured by the surrogate. • Coefficient of multiple determination and adjusted version
R2 does not reflect accuracy • Compare y1=x to y2=0.1x plus same noise (normally distributed with zero mean and standard deviation of 1. • Estimate the average errors between the function (red) and surrogate (blue). R2=0.9785 R2=0.3016
Cross validation • Validation consists of checking the surrogate at a set of validation points. • This may be considered wasteful because we do not use all the points for fitting the best possible surrogate. • Cross validation divides data into nggroups. • Fit the approximation to ng -1 groups, and use last group to estimate error. Repeat for each group. • When each group consists of one point, error often called PRESS (prediction error sum of squares) • Calculate error at each point and then present r.m.s error • For linear regression can be shown that
Model based error for linear regression • The common assumptions for linear regression • The true function is described by the functional form of the surrogate. • The data is contaminated with normally distributed error with the same standard deviation at every point. • The errors at different points are not correlated. • Under these assumptions, the noise standard deviation (called standard error) is estimated as • is used as estimate of the prediction error.
Comparison of errors • For the example in slide 4 of y=x plus the Gaussian noise the fit was=0.5981+0.9970x. • The noise came from randn, set to zero mean and unit standard deviation. However it had a mean of 0.552 and a standard deviation of 1.3. • The normal error is calculated as 1.32 and the cross validation (PRESS) error as 1.37. • With less data, the differences will be larger. • The actual error was only about 0.6 because the large amount of data filtered the noise.
Problems regression accuracy • The pairs (0,0), (1,1), (2,1) represent strain (millistrains) and stress (ksi) measurements. • Estimate Young’s modulus using regression. • Calculate the error in Young modulus using cross validation both from the definition and from the formula on Slide 5. • Repeat the example of y=x, using only data at x=3,6,9,…,30. Use the same noise values as given for these points in the notes for Slide 4.
Prediction variance in Linear Regression • Assumptions on noise in linear regression allow us to estimate the prediction variance due to the noise at any point. • Prediction variance is usually large when you are far from a data point. • We distinguish between interpolation, when we are in the convex hull of the data points, and extrapolation where we are outside. • Extrapolation is associated with larger errors, and in high dimensions it usually cannot be avoided.
Prediction variance • Linear regression model • Define then • With some algebra • Standard error
Example of prediction variance • For a linear polynomial RS y=b1+b2x1+b3x2find the prediction variance in the region • (a) For data at three vertices (omitting (1,1))
Interpolation vs. Extrapolation • At origin . At 3 vertices . At (1,1)
Standard error contours • Minimum error obtained by setting to zero derivative of prediction variance with respect to . • What is special about this point • Contours of prediction variance provide more detail.
Data at four vertices • Now • And • Error at vertices • At the origin minimum is • How can we reduce error without adding points?
Graphical Comparison of Standard Errors Three points Four points
Problems prediction variance • Redo the four point example, when the data points are not at the corners but inside the domain, at +-0.8. What does the difference in the results tells you? • For a grid of 3x3 data points, compare the standard errors for a linear and quadratic fits.