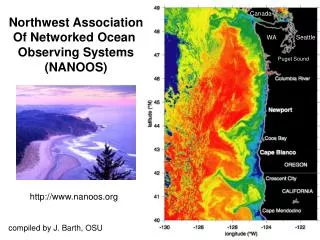
ISOPE, Seattle 2000
A UNIFIED APPROACH TO EXTREME VALUE ANALYSIS OF OCEAN WAVES. Harald E. Krogstad. Stephen F. Barstow. TRONDHEIM, NORWAY. ISOPE, Seattle 2000. CONTENTS. Multiple scale stochastic models Probability distributions for extreme values Short term parameterizations

ISOPE, Seattle 2000
E N D
Presentation Transcript
A UNIFIED APPROACH TO EXTREME VALUE ANALYSIS OF OCEAN WAVES Harald E. Krogstad Stephen F. Barstow TRONDHEIM, NORWAY • ISOPE, Seattle 2000
CONTENTS • Multiple scale stochastic models • Probability distributions for extreme values • Short term parameterizations • Analysis of storm histories • The maximum significant wave height • Dependence on short term distributions • Bootstrapping and assessment of reliability • Climatic variations • ISOPE, Seattle 2000
A multiple scale process: X is varying on a fast scale, whereas the state s(t) is a slowly varying process. The process is locally stationary. Examples: s Crest height Wave height Sign. wave height Sea state Sea state Seasonal/yearly variations • ISOPE, Seattle 2000
s(t) Locally constant t The extreme value distribution for a constant state: Time history: Distribution of states:
Dependent on: • The short term parametrization, • The time history or the distribution of states, s • Suitable period parameter The expressions tend asymptotically to extreme value distributions (typically Gumbel distributions) since they are of the form
1.2 Laser ,WADIC,Tern Marex radar 1.1 Wavestaff 1 Mode of maximum crest height/Hs Gaussian 0.9 Large buoy Waverider Presure cell 0.8 0.7 0.6 Number of waves, D/Tz 2 3 4 10 10 10 Various parametrisations illustrated by the mode of the non-dimensional crest height as a function of the number of waves
Time history Probability distributions 0.4 Hs Tz Expected value = 16.2 m 0.35 Expected value = 26.2 m 15 0.3 Observed value = 26.4 m 0.25 Hs (m), Tz (s) Probability density 10 0.2 0.15 5 0.1 0.05 0 0 5 10 15 20 25 10 15 20 25 30 35 Time (hours) Maximum wave/crest height (m) The Frigg storm (Courtesy of Elf Petroleum Norway) Time histories of storm events • ISOPE, Seattle 2000
Dependence on the short term parametrization From the left: Pressure cell data Gaussian sea Laser data From the left: Forristall analysis Næss formula Rayleigh
SIGNIFICANT WAVE HEIGHT (Rice’s formula and Poisson up-crossing of high levels) : Mean positive slope : Cumulative distribution of Hs
The Y year maximum significant wave height Engineering approach: D/Y independent events (D = duration of event) New formula:
Probability density of maximum significant wave height for an exposed Norwegian Sea location Engineering approach: Dotted line (depends on D) New formula: Solid line
Simplified formulae for the maximum wave height derived from the full expressions: (For typical North/Norwegian Sea long term Weibull distributions of Hs)
RELIABILITY ASSESSMENT FOR EXTREME WAVE AND CREST HEIGHTS • The short term parametrizations are (almost) universal • The long term statistics is site specific Intrinsic uncertainty: Remaining stochastic variability when the long term statistics is known. Additional uncertainty: Caused by incompletely known long term statistics Key problem: What is a certain long term data material worth? Simplistic approach: Try to estimate the equivalent amount of independent data and assess the reliability by bootstrapping (simulations).
0.4 0.5 0.35 0.4 0.3 0.25 0.3 0.2 Probability density Probability density 0.2 0.15 0.1 0.1 0.05 20 25 30 35 40 20 25 30 35 40 Wave height (m) Wave height (m) Analysis of reliability by bootstrapping Simulated variability of the expected maximum wave height (green) when the long term statistics is based on 1000 independent measurements (left) and 500 measurements (right). Intrinsic variability (probability density) of Hmax red, dashed.
Increased precision in the probability distribution for the maximum wave height as the size of the long term Hs data base increases (Expressed in terms of the number of independent measurements )
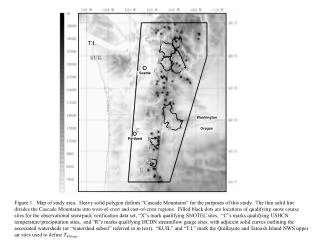
0.3 Whole period 0.25 74 - 87 88 - 93 0.2 Probabity density 0.15 80 % conf. intervals for E( Hmax ) 0.1 74 - 93 0.05 74 - 87 88 - 93 0 26 28 30 32 34 36 38 40 Maximum wave height (m) Probability density for the 100 year maximum wave height based on various sets of long term distribution data from Haltenbanken (Confidence intervals for E(Hmax) based on bootstrapping)
CONCLUSIONS • The relations for the extremes of multiple scale stochastic processes offer • a unified approach to estimation of extreme values of individual have and • crest height as well as the significant wave height. • The results depend on the probability distributions and the mean • up-crossing frequencies for the process (that is, the mean storm duration • for significant wave height). • Simplified methods may be derived and analyzed by means of the full • expressions.