Download
1 / 18
180 likes | 306 Views
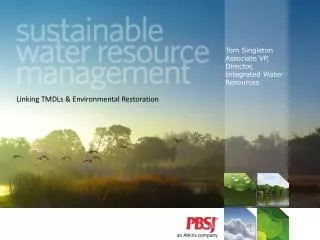
Tom Singleton Associate VP, Director, Integrated Water Resources. Linking TMDLs & Environmental Restoration. an Atkins company. Presentation Overview. Total Maximum Daily Loads (TMDLs) s tate-wide water quality conditions Sustainable water resource management definition

E N D
Tom Singleton Associate VP, Director, Integrated Water Resources Linking TMDLs & Environmental Restoration an Atkins company
Presentation Overview • Total Maximum Daily Loads (TMDLs) • state-wide water quality conditions • Sustainable water resource management • definition • Model world & reality • need to link water quality benefits with management actions • not all loads are equal • Science & engineering • it takes both • Uniqueness of place • the right projects in the right places
1160 Impaired Waters • 46% nutrients • 48% bacteria 16.8 million acres or 26,000 square miles of impaired watersheds $100-200 billion to restore water quality (FSA 2010)
Natural Systems Flooding Built Environment Water Supply Water Quality Sustainable Water Resource Management Comprehensively managing the highly complex relationships between communities & the land & water resources that sustain them
Most models overstate loads • Especially run-off volume • SCS curve number developed to size pipes not estimate annual runoff • Assume entire load reaches receiving water • fail to consider volume & pollutant attenuation within the watershed • Delivery ratio: • fraction of runoff that reaches receiving water • as low as 8% due to high internal storage in lakes & wetlands, especially in headwaters of watersheds • Need to reality test model estimates Source: Harvey Harper, FSA 2010
Insufficient information to properly characterize pollutants & select BMPs • Untreated stormwater • dissolved species – nutrients, heavy metals • particulates – suspended solids, nutrients, heavy metals • End of pipe runoff • doesn’t account for pre-treatment & characteristics of runoff reaching the receiving water • Need to verify loading conditions before selection & design of BMPs • inexpensive field verification monitoring Source: Harvey Harper, FSA 2010
Need to link water quality benefits with management actions • What is working, where it is working, & why it is working • Need to be able to distinguish between successful & unsuccessful management strategies: • water quality benefits realized, but not predicted by models • water quality benefits predicted by models, but not realized • Critical to document success: • past management actions are working • reasonable expectation that ongoing & planned management actions will lead to the restoration of water quality in due time
Need to link water quality benefits with management actions • Document water quality benefits of past management actions • review existing water quality & biological indicator status & trend reports • compare with pollutant loading model output to determine if changes in modeled loads are reflected in water chemistry • identify successful & unsuccessful management strategies (what) • identify where water quality assessments & models are accurately reflecting no trends, improving trends, or degrading trends (where) • identify the causes of disagreement between the assessments & the models • credit for load reductions & water quality restoration
Not all nutrient loads are equal • Stormwater & wastewater • differ in makeup, concentrations, & impacts • stimulate different amounts of biological productivity • yet, treated the same for most loading models
Nutrient Sources & Biological Productivity • Wastewater: • low volume, high concentration (up to 20 mg TN/liter), mostly inorganic • highly stimulating in both form of delivery & composition • Stormwater runoff: • high volume, moderate concentration (1-2 mg TN/liter), mostly organic • moderately stimulating in form of delivery & composition • Direct atmospheric deposition: • high volume, low concentration, mostly inorganic • least stimulating in form of delivery & composition • Conclusion: • a pound reduction of N from wastewater is worth more than a pound reduction of N from stormwater or atmospheric deposition
Water Quality Trading • Although expensive, wastewater reductions: • easier & less expensive per pound to implement & the benefits are much greater & easier to account for than nonpoint source reductions • can be used to offset nonpoint source load reductions • Example: Clay County Utility Authority • credits for construction of 2 advanced wastewater treatment plants & efficient operation of 2 other secondary treatment facilities that produce treated effluent below the TMDL target concentrations for domestic wastewater facilities • transfers up to 49,579 lb/year of TN in water quality credits from the Authority to offset the County’s required nonpoint source load reduction of 48,159 lb/year of TN
Water Quality Trading • Credits valued at $186.25 per pound of TN removed: • $45,160,233 cost of Authority projects / 242,467 lb TN removed by the projects per year • credit price is adjusted annually to cover the cost to Authority of carrying the debt • total value of credits: $8,083,250 (43,400 lb/yr TN x $186.25) • Win-Win-Win: • Authority: approx. 20% of wastewater improvements funded by County’s stormwater program • County: cost-effective & achievable load reductions • State: restored water quality
Sustainable Water Resource Management • Comprehensively managing water across diverse watersheds: • respecting the “uniqueness of place” Molecular structure of a diamond
Proposed interim water quality targets & restoration project types for WHCL based on EPA’s Numeric Nutrient Criteria
Science & Engineering Observe Analyze Design Construct and planning Need sound science to have sound engineering
Thank you! Tom Singleton 850-580-7929 tlsingleton@pbsj.com an Atkins company