Download
1 / 55
570 likes | 859 Views
Safety Across the World International Patient Safety Symposium November 10, 2011. Maureen Bisognano President and CEO IHI.

E N D
Safety Across the WorldInternational Patient Safety SymposiumNovember 10, 2011 Maureen Bisognano President and CEO IHI
At 2pm yesterday, the urologist's office called to say that Bob was scheduled for 8am surgery today and to make sure he was drinking only liquids. Everything was OK at their end.At 4pm yesterday, Bob's cardiologist's office called to say that they just got a call from the anesthesiologist - the one who would be working w/the urologist - to say that the surgery cannot be performed since Bob's cardiologist did not fill out the 'approval for surgery letter' with the right terminology, and that the cardiologist is on vacation this week and cannot be contacted at all. Sonsabitches!! Bob's blood pressure shot up so high I thought he was gonna have a stroke!Bob then proceeded to leave voice mail messages for 3 people in the urologist's office, finally getting a human being to ask that the surgeon give him a call asap.At 6:30pm, the surgeon called to say that he had just spoken to the anesthesiologist and he concurs that the surgery cannot be performed until said cardiologist returns to the office to fill out the proper paperwork and for Bob to possibly have more invasive testing before surgery, even though he's had every battery of pre-surgery tests known to man. It seems that the person in the pre-surgery office OR the assistant to the anesthesiologist did not take the time to make sure ALL of Bob's paperwork was in order for the surgery before the 11th hour! Bob already filled out office paperwork to take a leave of absence from work, along with a half-pay medical leave, so he's pretty mad about this last minute cancellation and so am I. Today 11am - the very busy urologist called back to give a tentative surgery date of Tuesday, 11/08 (another 2 wks. from now)The waiting continues, along with the emotional drain and frustration for Bob and our family. Thanks for caring.
Hi Sophie, Of course you can tell our ongoing saga about Uncle Bob’s eventual surgery. Even though the surgeon is not in any hurry, this surgery is important to us since Bob has a large cancerous tumor growing outside his bladder PLUS a non-functioning left kidney that must be removed before it becomes dangerous in any way. And adding to these problems, Bob has high blood pressure and diabetes, along with other medical issues! I guess I definitely need to stay strong and healthy to keep this family going. Hang in there toots. Hugs, Aunt Rhonda
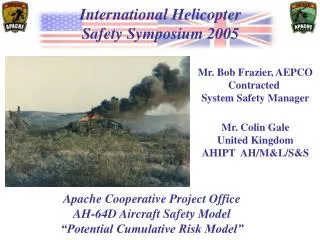
Safety in Aviation • Design • Reliability • Checklists • Human Factors Sully Sullenberger
Sullenberger’s Priorities • Fly the plane • Deal with the situation • Communicate • 208 seconds
Sullenberger’s Decision “My aircraft” … “your aircraft” • All options for landing on left side • More hours in that plane • 11 months since simulation training…co-pilot: 1 week • Co-pilot’s first time in Airbus
Sully on Sully • Physical stress causes increased blood pressure, increased heart rate, and narrowed vision • Forced calm on himself • “Be the swan” • Imposed order on chaos • Chose to do only critical things
Safety in Healthcare • Design • Reliability • Checklists • Human Factors • Systems knowledge “To Err is Human” (1999)
Diagnostic Journey • Do people die unnecessarily every day in our hospitals? • In order for us to understand this, we need a diagnostic journey that moves out of a model for judgment and into a model for learning.
The Mortality Diagnostic – 2x2 Matrix • Review most recent 50 consecutive deaths • Place them into a two by two matrix based on:- Was the patient admitted for palliative care?- Was the patient admitted to the ICU? • Focus your work initially on boxes that have at least 20% of your mortality
Diagnostic – The 2 x 2 Matrix Admitted to the ICU? Yes No Yes Admitted for Palliative Care Only? No
The Mortality Diagnostic:Failure to Recognize, Plan, Communicate • Analyze deaths in box 3 and 4 for evidence of failure to: recognize, communicate, plan • This will help you understand the local environment
Recognize, Communicate, Plan Failure to Recognize: Any situation in which a patient has died and there was evidence that an intervention could have been made anytime prior to the patient’s death Example: the staff was worried, change in heart rate, change in respiratory rate, change in blood pressure, change in O2 saturation or change in consciousness or neurological status that was not responded to. Failure to Plan, such as: diagnosis, treatment, or calling a rescue team. Failure to Communicate: Patient to staff, clinician to clinician, inadequate documentation, inadequate supervisor, leadership (no quarterback for the team), etc.
The Mortality Diagnostic:The Impact of Care Evaluate ALL deaths in box 3 and box 4 to assess the estimated impact of our care on mortality: *As you review the deaths in box 3 & 4, ask yourself the questions honestly (focusing on learning, not judgment): • Was perfect care rendered? • If perfect care wasn’t rendered, could the outcome of death have been prevented if the care had been better? • What number of deaths could have been prevented?
The Mortality Diagnostic:Evidence of Adverse Events • Analyze deaths in box 3 and 4 for evidence of adverse events using the Global Trigger Tool • This will give some further direction to local problems
Global Trigger Tool • Review chart for triggers that are sensitive and specific for harm • Find a trigger – Was there harm? • Not all triggers mean there was harm!
Global Trigger Tool Modules • Cares (General) • Critical Care • Medication • Surgery • L&D • ED
Example of a trigger:Transfer to higher level of care • Endoscopy • Post procedure somnolent and hypotensive (BP 80) transferred to ICU • Placed on Bi-Pap • Received standard Demerol and Versed for procedure • Given Romazicon; stayed in unit 12 hours
Global Trigger Tool Examples • Readmit within 30 days with recurrence of abscess right hip • Readmit next day w/ileus s/p exp lap for tumor • Stopped lasix-acute renal failure • Readmitted in 30 days for wound revision due to incisional seroma • Readmit related with wound infection • Volume Depletion with altered mental status caused by Lasix -resulted in hospital admission • ARF due to nephrotoxicity due to combination of ACE and NSAIDS taken at home • Ischemic colitis had rthemicolectomy. New onset CP=MI Unresponsive, coded. Decreased loc & sats on Morphine PCA. Rec'd Narcan
Kaiser Permanente:“Saving Lives by Studying Deaths” • To address substantial variation across their hospitals, KP quality leaders led an efficient and effective method of investigating mortality to find patterns of harm • Used IHI’s Global Trigger Tool and 2x2 mortality matrix, as well as other tools • Multidisciplinary teams studied the 50 most recent inpatient deaths at 11 KP hospitals Source: Lau H, Litman K. “Saving Lives by Studying Deaths: Using Standardized Mortality Ratios to Improve Inpatient Safety.” The Joint Commission Journal. 37(9): September, 2011.
Source: Lau H, Litman K. “Saving Lives by Studying Deaths: Using Standardized Mortality Ratios to Improve Inpatient Safety.” The Joint Commission Journal. 37(9): September, 2011.
Source: Lau H, Litman K. “Saving Lives by Studying Deaths: Using Standardized Mortality Ratios to Improve Inpatient Safety.” The Joint Commission Journal. 37(9): September, 2011.
Source: Lau H, Litman K. “Saving Lives by Studying Deaths: Using Standardized Mortality Ratios to Improve Inpatient Safety.” The Joint Commission Journal. 37(9): September, 2011.
Storytelling • Project leaders incorporated the use of de-identified patient narratives to get at the circumstances behind the data. • Stories were selected to share with hospital leaders to identify common issues that would help drive improvement. Source: Lau H, Litman K. “Saving Lives by Studying Deaths: Using Standardized Mortality Ratios to Improve Inpatient Safety.” The Joint Commission Journal. 37(9): September, 2011.
Results • 10 categories of harm were identified (listed below in order of decreasing frequency): • Harm occurring before hospitalization • Hospital-acquired infection • Failure to plan • Failure to communicate • Other harm • Hospital-acquired pressure ulcer • Surgical/procedural complication • Failure to rescue • Medication event • Fall • In response, hospital leaders identified 36 quality improvement goals to pursue. Source: Lau H, Litman K. “Saving Lives by Studying Deaths: Using Standardized Mortality Ratios to Improve Inpatient Safety.” The Joint Commission Journal. 37(9): September, 2011.
Specific Outcome Aims forAcademic and District General Hospitals By January 2011 • Mortality: 15% reduction • Adverse events: 30% reduction • Ventilator associated pneumonia: 0 or 300 days between • CL CR-BSI: 0 or 300 days between • Blood sugars w/in range (ITU/HDU): 80% or > w/in range • Staph aureusbacteraemias: 30% reduction • Crash Calls: 30% reduction • Harm from anti-coagulation: 50% reduction in ADEs • Surgical site infections: 50% reduction (clean)
The Scottish Patient Safety Program • NHS Quality Improvement Scotland • The Scottish Government Health Directorate • The Institute for Healthcare Improvement
Patient Safety Alliance Programme Driver Diagram Primary Drivers Secondary Drivers Ownership of agreed upon set of outcomes Review of outcomes at each meeting Quality and safety comprises 25% of agenda Recovery plans for unmet outcomes Infrastructure supports improvement and measurement Involve patients in safety Boards Accept Safety as Key Strategic Priority for Effective Governance Scottish Executive Sets PSA as Strategic Priority Robust, evidence based proven clinical changes IHI/QIS Team Expert at Content, Coaching and Programme Management Align national SPSP with national improvement programmes and measures Demonstrable results to community Clear, shared measurement set Visible on all senior leader agenda PSA represents & demonstrates cohesive, united programme Improve Safety of Hospital Healthcare Services in Scotland Acceptance of pragmatic science Royal College Supports PSA Programme International expert clinical faculty Faculty expert at improvement methods and coaching Programme design and structure Inventory national programmes and measurements Meet with programme leader to understand programme intent, audience, history Harmonize our metrics
Scottish Patient Safety Program (SPSP) Critical Care Central Line BSI Rate November 2007 through December 2010 (Goal: 0 CL BSIs) Central Line BSI rate (BSIs per 1000 central line days) T1 Median = 2.7 T2 Median = .71 (74% decrease)
Scottish Patient Safety Program (SPSP) VAP RateMarch 2008 through December 2010 (Goal: 0 VAPs) T1 Median = 8.4 VAP Rate (VAPs per 1000 ventilator days) T2 Median = 4.6 (45% decrease)
Scottish Patient Safety Program (SPSP) Critical Care C. Diff Rate January 2008 through December 2010 (Goal: 50% reduction) T2 Median = 0.46 (72% Decrease) T1 Median = 1.6 C. Diff Rate per 1000 patient days T2 Median = .44 (73% decrease)
Serious Safety Event PreventionHospital Wide Effort - #1 Priority 36 SSE’s Prevented 2010 Goal
Case Study - HAI • Reducing hospital acquired infections • Our “breakthrough” effort
Reducing Hospital Acquired InfectionsImproved Medical Outcomes & Error Elimination • Clinical initiatives to reduce Catheter Associated Bloodstream Infections (BSI), Surgical Site Infections (SSI) & Ventilator Associated Pneumonia (VAP) were initiated • At time, our rates were close to the national averages: • BSI rate = About 2 out of every 100 children with a catheter • SSI rate = About 1.5 out of every 100 children receiving surgery • VAP rate = About 4 out of every 100 children placed on a vent • Our own data suggested that maybe 15-20% of kids in the ICU who acquired a BSI, VAP or other serious infection might be expected to die
Reducing Hospital Acquired InfectionsImproved Medical Outcomes & Error Elimination • Interventions aimed at reducing infection rates were developed from published best practices & our own observations & thoughts • Development of Pediatric Specific Bundles for Care Delivery • Intense focus on Execution • Transparency of Results • Outcomes drive Culture Change
Reducing Hospital Acquired InfectionsImproved Medical Outcomes & Error Elimination • What was achieved in first 2 years: • BSI rate reduced by 60%; meaning 29 fewer kids suffered a preventable infection • SSI rate reduced by 60%; meaning 50 fewer kids suffered a preventable infection • VAP rate reduced 90%; meaning 70 fewer kids suffered pneumonia in our ICU • MOST IMPORTANTLY potentially 20 children went home from our hospital that statistically may not have been expected to be do so!
4.0 0.8
Quantifying the Financial Impact of An Enormous QI Success • Brilliant Hypothesis: A HAI is “Bad Business” • Clinical Outcome not as good – inability to differentiate our product • Poor customer Value - dollars spent in treating infection = waste • Potential high opportunity cost – bed occupied by HAI could effect flow and ability to meet access needs of out-of-area admission • Poor Patient Experience • We needed a proven methodology to test and conclusively measure our hypothesis
Comparative Matched-Case Study Design • Chart reviews to define candidates and assess whether SSI was potentially preventable • Matched Case-Control Design • Initial OR Cost of SSI case = Control (No SSI) OR Case • Cumulative Cost at time of discharge of Control case = SSI Case • Match criteria: same or equivalent surgical procedure, age, procedure date, co-morbidities • Excluded patients with cancer, immune deficiency, neonates or over 19 yrs old • 16 Patients in final statistical analysis Sparling KW, Ryckman FC, Schoettker PJ et al. Qual Mngt in Health Care 2007;16:219-225.
SSI ResultsAggregate Cumulative Charges $1,740,000 Ave LOS = 16.0 days $793,000 Ave LOS = 4.6 days Sparling KW, Ryckman FC, Schoettker PJ et al. Qual Mngt in Health Care 2007;16:219-225.
Reducing Hospital Acquired InfectionsImproved Medical Outcomes & Error Elimination Nothing compares to the human impact of this effort & nothing is even remotely as important; but there is more: • We reduced thecosts to the health care system by $11.2 million annually • And we reclaimed 5 beds per year previously dedicated to infections that could now be dedicated our core strategy of unique program development
Maximizing Asset Production –Revenue Production Associated with SSI
90 Day Revenue Production CycleWhen 6 Patients Develop an SSI
Same 90 Day Cycle of Revenue Production If No Patients Acquire SSI (18 patient potential)