Download
1 / 24
290 likes | 585 Views
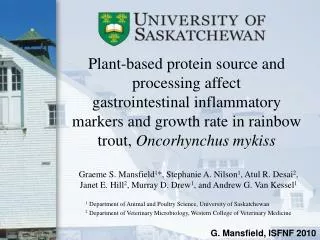
Plant-based protein source and processing affect gastrointestinal inflammatory markers and growth rate in rainbow trout, Oncorhynchus mykiss. Graeme S. Mansfield 1 *, Stephanie A. Nilson 1 , Atul R. Desai 2 , Janet E. Hill 2 , Murray D. Drew 1 , and Andrew G. Van Kessel 1

E N D
Plant-based protein source and processing affect gastrointestinal inflammatory markers and growth rate in rainbow trout, Oncorhynchusmykiss Graeme S. Mansfield1*, Stephanie A. Nilson1, Atul R. Desai2, Janet E. Hill2, Murray D. Drew1, and Andrew G. Van Kessel1 1 Department of Animal and Poultry Science, University of Saskatchewan 2 Department of Veterinary Microbiology, Western College of Veterinary Medicine
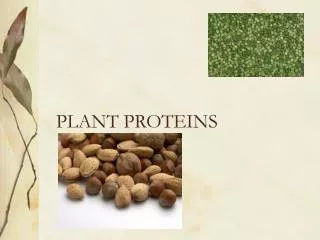
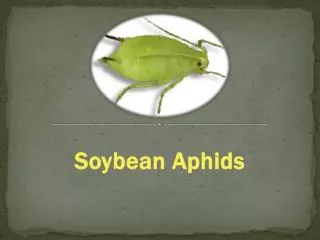
Plant-based ProteinsSoybean Meal • Research into plant-based alternative proteins has been primarily focused on soybean • Results suggest that inclusion of soybean should be limited to 30% or less • Data from these studies also points to the distal gut as the major location of observable changes in physiology
Soybean MealChanges in Villus Morphology 0% SBM 10% SBM 35% SBM (Krogdahl et al. 2003)
Plant-based ProteinsPeas and Canola • Factors limiting inclusion of SBM and other plant-based protein sources have yet to be determined • Other plant-based protein sources have received less attention • Canola and pea products show promise as alternative protein sources for salmonids • Comparative studies examining intestinal physiological responses may help identify limiting factors
Antinutritional Factors in Ingredients • Soybean • Lectins • Oligosaccharides • Phenolic compounds • Phyticacid • Trypsin inhibitors • Glycinin and β-conglycinin • Goitrogens • Isoflavones • Saponins • Urease • Pea • Lectins • Oligosaccharides • Phenolic compounds • Phyticacid • Trypsin inhibitors • Flavinols • High Starch & Fibre • Canola • Oligosaccharides • Phenolic compounds • Phytic acid • Erucic acid • Glucosinolates
Processing of Ingredients • Meal • Minimally refined, meals retain many of the ANF’s present in the raw seed • Protein Concentrate • Alcohol extraction (soy), aqueous extraction (canola), or air fractionation (pea) processes produce purified protein concentrates with reduced ANF’s
Hypothesis • Correlation of physiological changes in the trout gastrointestinal tract to the degree of processing, inclusion level, and source of plant protein in the diet will help identify factors limiting dietary inclusion
Research Objectives • Evaluate the effect of increasing inclusion rates of model ingredients on expression of selected genes in the distal gut • Correlate gene expression with growth performance data, plant-based protein source, and inclusion level
Experimental Diets • Diets • Plant-based protein sources • Soybean, Canola, Pea • Levels of processing • Meal, Protein concentrate • Inclusion rates • 0, 7.5, 15, 22.5, and 30% • Diet formulation • 17.58 MJ/kg DE; 386.2 g/kg dig. CP
Experimental Design • Recirculation system at Prairie Aquaculture Research Centre • 360 L tanks • 3 tanks per diet • Photoperiod: 14 h light/10 h dark • Water temperature: 15 1 C • 56 day feeding period • 6 growth trials, one for each ingredient
Sample Collection • Fish from the 0, 15, and 30% diets were sampled • 3 fish from each tank • 9 fish per diet • Distal gut tissue was snap frozen in liquid nitrogen • Stored at -80°C
Sample Preparation • Total RNA was extracted and quantified by absorbance spectrophotometry • A260/A280 nm • First-strand cDNA was generated by reverse transcription of 1.0 µg of total RNA
Gene Expression Targets • Housekeeping genes • Beta-actin (β-act) • 18S rRNA • Elongation factor-1α (EF-1α) • Gene expression targets • Interleukin-1β (IL-1β) • Interleukin-8 (IL-8) • Immunoglobulin M (IgM) • Proliferating Cell Nuclear Antigen (PCNA) • Interleukin-10 (IL-10) • Primer specificity validated by PCR product sequencing
Statistical Analysis • Expression data analyzed by GLM procedure of SPSS 14.0 • Differences between means determined by Tukey’s HSD • Pearson correlation coefficients were calculated between all experimental parameters • Gene expression, growth performance, protein source, and inclusion level
Results • All housekeeping genes were significantly affected by treatment • Expression data is reported as transcript copy number per 50 ng total RNA • Correlations made with specific growth rate
ResultsEF-1α Gene Expression Values are mean EF-1α expression ± SEM abMeans in the same row with different superscripts are significantly different (P < 0.05)
Correlative relationships between experimental variables PCNA IL-1β IgM Inflammatory IL-8 Ingredients PM SBM Growth CM Anti-inflammatory IL-10 Positive Correlation Negative Correlation
Pea Meal Y = 0.0028x + 1 R² = 0.39 P =0.265
Soybean Meal Y = -0.0337x + 1.5498 R2 = 0.9844 P = 0.001
Canola Meal Y = -0.0184x + 0.9242 R² = 0.9100 P = 0.002
Conclusions • PCNA is positively correlated to inflammatory markers • SGR is negatively correlated with IL-1β and IL-8 • High levels of SBM or CM reduce growth but only SBM induces inflammation • Suggests CM is operating by a different mechanism • Putative ANF’s common between SBM and CM are not inflammatory mediators • PM or any protein concentrate ingredient show no significant correlations up to 30% inclusion