Download
1 / 13
130 likes | 270 Views
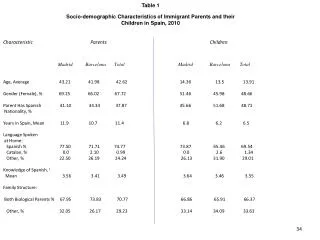
Table 1 Socio-demographic Characteristics of Immigrant Parents and their Children in Spain, 2010. Characteristic Parents Children.

E N D
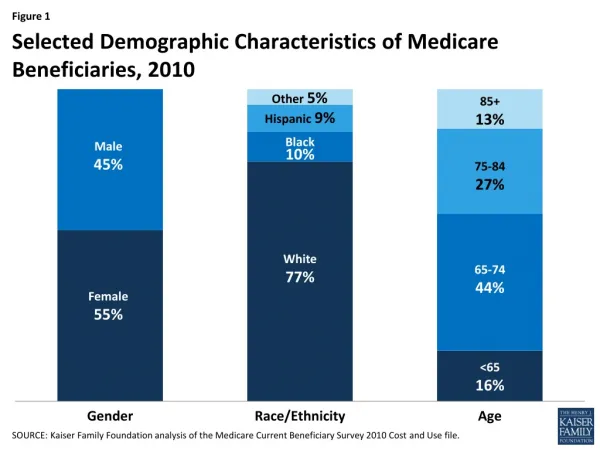
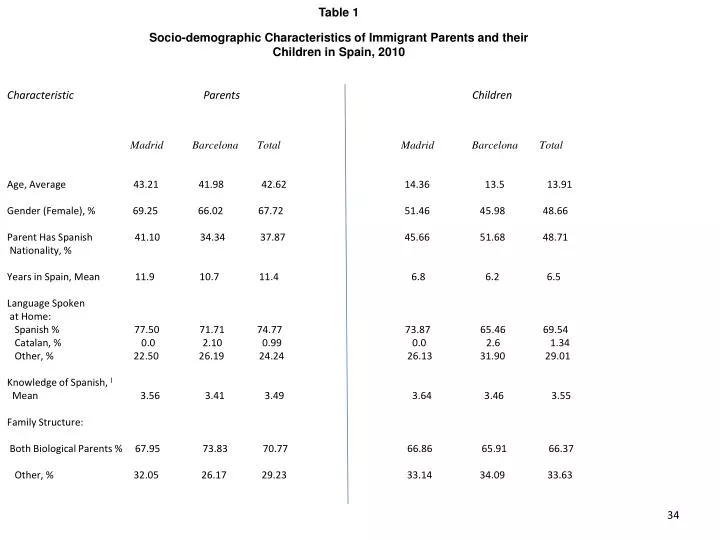
Table 1 Socio-demographic Characteristics of Immigrant Parents and their Children in Spain, 2010 Characteristic Parents Children Age, Average 43.21 41.98 42.62 14.36 13.5 13.91 Gender (Female), % 69.25 66.02 67.72 51.46 45.98 48.66 Parent Has Spanish 41.10 34.34 37.87 45.66 51.68 48.71 Nationality, % Years in Spain, Mean 11.9 10.7 11.4 6.8 6.2 6.5 Language Spoken at Home: Spanish % 77.50 71.71 74.77 73.87 65.46 69.54 Catalan, % 0.0 2.10 0.99 0.0 2.6 1.34 Other, % 22.50 26.19 24.24 26.13 31.90 29.01 Knowledge of Spanish, 1 Mean 3.56 3.41 3.49 3.64 3.46 3.55 Family Structure: Both Biological Parents % 67.95 73.83 70.77 66.86 65.91 66.37 Other, % 32.05 26.17 29.23 33.14 34.09 33.63 34
Table 1, continued Characteristic Parent Children Parental Education2: Less than Secondary % 42.19 48.95 45.59 17.34 15.80 16.55 Secondary, % 40.07 34.72 37.46 34.22 25.81 29.94 Some University, % 8.80 9.55 9.16 10.37 9.22 9.78 University graduate, % 8.94 6.78 7.89 11.53 9.80 10.65 Does not know, % -- -- -- 26.54 39.37 33.08 Parental Employment Situation3: Employed, % 60.66 57.19 58.97 87.69 80.80 84.17 Unemployed, % 23.69 22.46 2309 10.23 17.30 13.84 Disabled, other, % 15.65 20.35 17.94 2.08 1.90 1.99 Parental Occupation4: Average Prestige Score 85.13 86.43 85.75 87.96 88.55 88.26 Educational Aspirations for Child: Secondary or less, % 4.98 5.57 5.26 25.64 28.05 26.86 Technical degree, % 17.20 12.72 15.07 21.64 15.14 18.35 Some University, % 1.97 3.64 2.76 14.21 15.67 14.96 University degree, % 59.68 62.84 61.19 29.13 31.14 30.13 Post-graduate, % 16.17 15.23 15.72 9.38 10.03 9.70 35
Table 1, continued Characteristic Parents Children Educational Expectations for Child: Secondary or less, % 12.98 17.06 14.93 45.07 43.57 44.32 Technical degree, % 32.60 25.49 29.21 22.33 18.12 20.20 Some university, % 5.83 13.20 9.39 11.89 13.51 12.70 University degree, % 39.25 33.45 36.48 15.61 18.69 17.17 Post-graduate degree, % 9.25 10.80 9.99 5.10 6.11 5.61 Future Life Plans for Child5: Live in Spain, % 84.69 85.35 85.00 27.24 24.54 25.90 Move Elsewhere, % 15.31 14.65 15.00 72.76 75.45 74.10 • Scores in the Knowledge of Spanish Index (KSI). Range: 1 (lowest) to 4. • Parental figures refer to the parent answering the survey; children’s figures are a weighted average of reported education for father and mother. • Parental figures refer to the parent answering the survey; children’s figures are a weighted average of reported employment situation for father and mother. • Scores in the PRESCA-2 Spanish occupational prestige scale (Carabańa and Gomez Bueno, 1997). • Item in the parental survey asks whether the parent wishes child to stay and live in Spain; item in the children’s survey asks for preferred country to live as an adult. Source: Longitudinal Study of the Second Generation (ILSEG). 36
Table 3-A Determinants of Educational Aspirations among Second Generation Youths in Spain, 2010 Predictors1 I II III IV Coeff. 2 Z-ratio Coeff. 2 Z-ratio Coeff. 2 Z-ratio Coeff. 2 Z-ratio Parent: -Age -.005 -0.67 -.001 -0.18 .001 0.16 .003 0.27 -Gender (Female) .067 0.66 .068 0.63 -.051 -0.46 -.016 -0.14 -Years of Spanish .013 1.66 .010 1.32 -.002 -0.20 -.006 -0.57 Residence -Nationality (Spanish) -.041 -0.40 -.082 -0.80 -.091 -0.87 .015 0.13 -Both Parents Present -.120 -1.13 -.150 -1.38 -.213 -1.89# -.233 -1.99* -Socio-economic Status .631 9.06*** .473 6.43*** .444 5.69*** .373 4.40*** (PSES) -Knowledge of Spanish .207 2.75** .091 1.09 .020 0.22 .162 1.51 (PKSI) -School Involvement .011 0.12 -.015 -0.16 .016 0.17 (PSII) -Educational Aspirations .205 2.63** .121 1.47 .145 1.72# -Educational Expectations .607 9.93*** .491 7.51*** .479 7.18*** Child: -Age -.467 -7.20*** -.505 -7.21*** -Gender (Female) .427 4.26*** .390 3.82*** -Birthplace (Spain) .223 1.17 .071 0.35 -School Type (Private) .147 1.17 .154 1.20 -Year in School .300 3.03** .310 3.11** -Knowledge of Spanish .537 5.38*** .608 5.93*** (KSI) -City of Residence -.156 -1.33 (Barcelona) National Origin3 : -Ecuador -.442 -2.35* 38
Table 3-A (Cont.) Predictors I II III IV Coeff. 1 Z-ratio Coeff. 2 Z-ratio Coeff. 2 Z-ratio Coeff. 2 Z-ratio • / Cut 1 -1.367 .092 -4.683 -4.572 • / Cut 2 -0.304 1.225 -3.480 -3.361 • / Cut 3 0.861 2.478 -2.095 -1.959 • Wald Chi Sq. 123.43*** 263.80*** 366.24*** 391.07*** • Pseudo R2 .028 .065 .100 .106 • N 1665 1636 1577 1576 • See Appendix for variable measurement. • Ordered logistic regression coefficients. • Dummy variables for 17 different nationalities are included in Step IV; only significant coefficients are presented. • # p < .10 • * P < .05 • ** p < . 01 • *** p < .001 • Source: Longitudinal Study of the Spanish Second Generation (ILSEG) 39
Table 3-B Determinants of Educational Expectations among Second Generation Youths in Spain, 2010 Predictors1 I II III IV Coeff. 2 Z-ratio Coeff. 2 Z-ratio Coeff. 2 Z-ratio Coeff. 2 Z-ratio Parent: -Age -.005 -0.69 -.002 -0.22 .000 0.08 .003 0.38 -Gender (Female) -.019 -0.19 - .001 -0.01 -.097 -0.88 -.050 -0.45 -Years of Spanish .015 2.32* .012 1.80# -.001 -0.13 -.006 -0.70 Residence -Nationality (Spanish) -.087 -0.89 -.104 -1.03 -.124 -1.21 -.045 -0.41 -Both Parents Present .022 0.22 .005 0.05 -.033 -0.31 -.058 -0.53 -Socio-economic Status .504 7.47*** .333 4.70*** .279 3.82*** .259 3.23** (PSES) -Knowledge of Spanish .162 2.25* .041 0.50 .019 0.22 .161 1.52 (PKSI) -School Involvement -.028 - 0.32 -.050 -0.56 .008 0.09 (PSII) -Educational Aspirations .208 2.54* -.128 1.49 .139 1.58 -Educational Expectations .611 9.93*** .505 7.81*** .506 7.58*** Child: -Age -.448 -7.09*** -.438 -6.39*** -Gender (Female) .166 1.74# .134 1.39 -Birthplace (Spain) .319 1.74# .112 0.58 -School Type (Private) .115 0.93 .135 1.06 -Year in School .312 3.16** .311 3.08** -Knowledge of Spanish .524 5.12*** .603 5.97*** (KSI) -City of Residence .095 0.85 (Barcelona) National Origin 3 : -Argentina -.710 -2.09* -Ecuador -.522 -2.91** -Peru -.527 -2.38* 40
Table 3-B (Cont.) Predictors I II III IV Coeff. 1 Z-ratio Coeff. 2 Z-ratio Coeff. 2 Z-ratio Coeff. 2 Z-ratio • / Cut 1 -.860 .544 -3.817 -2.869 • / Cut 2 .474 1.972 -2.294 -1.336 • / Cut 3 1.535 3.099 1.092 -0.112 • Wald Chi Sq. 78.80*** 222.92*** 320.86*** 348.52*** • Pseudo R2 .018 .053 .082 .089 • N 1651 1622 1564 1563 • See Appendix for variable measurement. • Ordered logistic regression coefficients. • Dummy variables for 17 different nationalities are included in Step IV; only significant coefficients are presented. • # p < .10 • * P < .05 • ** p < . 01 • *** p < .001 • Source: Longitudinal Study of the Spanish Second Generation (ILSEG) 41
Table 4-A Determinants of Occupational Aspirations among Second Generation Youths in Spain, 2010 Predictors1 I II III IV Coeff. 2 Z-ratio Coeff. 2 Z-ratio Coeff. 2 Z-ratio Coeff. 2 Z-ratio Parent: -Age -.002 -0.23 .001 0.18 .005 0.58 .004 0.49 -Gender (Female) .033 0.29 .039 0.33 -.084 -0.68 -.062 -049 -Years of Spanish -.000 -0.01 -.003 -0.38 -.011 -1.06 -.015 -1.26 Residence -Nationality (Spanish) .011 0.10 -.003 -0.03 -.001 -0.01 .079 0.61 -Both Parents Present .288 2.38* .312 2.54* .253 1.98# .246 1.88# -Socio-economic Status .054 0.75 -.052 -0.67 -.104 -1.24 -.074 -0.81 (PSES) -Knowledge of Spanish .302 3.45*** .226 2.42* .210 2.03* .307 2.47* (PKSI) -School Involvement .037 0.38 .006 0.06 - .023 -0.22 (PSII) -Educational Aspirations .092 0.98 .049 0.50 .065 0.65 -Educational Expectations .324 4.58*** .202 2.74** .173 2.31* Child: -Age -.283 -3.97*** -.344 -4.46*** -Gender (Female) .725 6.49*** .715 6.32*** -Birthplace (Spain) .146 0.72 .097 0.45 -School Type (Private) .257 1.77# .298 2.03* -Year in School .284 2.57* .318 2.82** -Knowledge of Spanish .245 2.14* .220 1.81# (KSI) -City of Residence -.239 -1.87# (Barcelona) National Origin 3 : -Argentina -1.049 -2.33* 42
Table 4-A (Cont.) Predictors I II III IV Coeff. 1 Z-ratio Coeff. 2 Z-ratio Coeff. 2 Z-ratio Coeff. 2 Z-ratio • Constant -1.571 -3.13 -2.495 -4.31 .079 0.07 .956 0.74 • Wald Chi Sq. 19.69** 50.46*** 105.94*** 123.38*** • Pseudo R2 .010 .025 .059 .069 • N 1592 1563 1508 1507 • See Appendix for variable measurement. • Binomial logistic regression coefficients. • Dummy variables for 17 different nationalities are included in Step IV; only significant coefficients are presented. • # p < .10 • * P < .05 • ** p < . 01 • *** p < .001 • Source: Longitudinal Study of the Spanish Second Generation (ILSEG) 43
Table 4-B Determinants of Occupational Expectations among Second Generation Youths in Spain, 2010 Predictors 1 I II III IV Coeff. 2 t Coeff. 2 t Coeff. 2 t Coeff. 2 t Parent: -Age -.016 -0.05 .116 0.37 .075 0.24 .110 0.38 -Gender (Female) -2.529 -0.53 2.773 -0.56 -8.033 -1.56 -7.681 -1.45 -Years of Spanish -.002 -0.01 -.058 -0.20 -.706 -2.11* -.403 -1.33 Residence -Nationality (Spanish) -3.252 -0.82 -3.561 -0.91 -4.214 -1.03 -3.475 0.80 -Both Parents Present -5.826 -1.24 -5.953 -1.26 -7.625 -1.56 -7.126 -1.62# -Socio-economic Status 7.711 4.16*** 4.650 2.25* 2.643 1.25 3.259 1.47 (PSES) -Knowledge of Spanish 5.249 2.09* 2.750 1.15 .735 0.25 .219 0.07 (PKSI) -School Involvement .447 0.14 .453 0.15 -.573 -0.16 (PSII) -Educational Aspirations 2.762 0.49 .410 0.07 -.703 -0.11 -Educational Expectations 8.601 2.54* 5.366 1.60# 4.828 1.44 Child: -Age -7.111 -3.20*** -6.765 -2.91** -Gender (Female) 11.920 2.88** 12.472 3.01** -Birthplace (Spain) 13.848 1.42 16.620 1.45 -School Type (Private) 1.773 0.48 2.414 0.66 -Year in School 10.551 3.85*** 11.273 3.82*** -Knowledge of Spanish 12.776 3.02** 11.888 2.92** (KSI) -City of Residence 4.065 1.19 (Barcelona) National Origin 3 : -Argentina -22.562 -1.85# 44
Table 4-B (Cont.) Predictors I II III IV Coeff. t Coeff. 2 t Coeff. 2 t Coeff. 2 t • Constant 142.824 9.07 119.664 7.14 176.369 5.38 183.694 3.89 • F 5.17*** 6.63*** 8.78*** 4.96*** • R2 .010 .020 .043 .056 • N 1615 1588 1530 1529 • See Appendix for variable measurement. • Ordinary least squares unstandardized coefficients with robust standard errors. • Dummy variables for 17 different nationalities are included in Step IV; only significant coefficients are presented. • # p < .10 • * P < .05 • ** p < . 01 • *** p < .001 • Source: Longitudinal Study of the Spanish Second Generation (ILSEG) 45