Download
1 / 1
10 likes | 113 Views
Analysis of Ozone Concentrations in a Dissipating Tropical Convective System during TC-4. A .M. Bryan 1 , K. Obenour 1 , D. Slotke 1 , G.A. Morris 2.

E N D
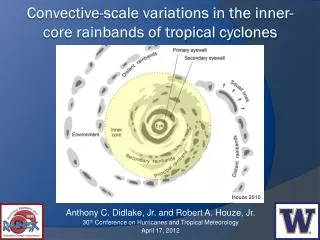
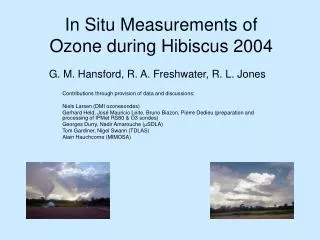
Analysis of Ozone Concentrations in a Dissipating Tropical Convective System during TC-4 A.M. Bryan1, K. Obenour1, D. Slotke1, G.A. Morris2 1Dept. of Geography & Meteorology, Valparaiso University, Valparaiso, IN • 2Dept. of Physics & Astronomy, Valparaiso University, Valparaiso, IN Ozone Production Abstract Forcings Behind Undulations Twenty-five balloon-borne ozonesondes were launched in Las Tablas, Panama during the period 13 July to 9 August 2007 as part of the NASA TC-4 field campaign. One sounding underwent four distinct convective undulations between the altitudes of 2 – 5 km over a period of 90 minutes during ascent, allowing the rare and unique opportunity for in situ analysis of temporal variations of ozone within a convective cell. Ozone concentrations within the convective layer steadily increased by 10 – 15 ppb, suggesting local production via lightning or convectively-influenced transport of ozone. The results Figure 5 Undulations observed on 5 Aug 2007 are manifest in the altitude vs. time plotted above. The color codes distinguish the ascent portions of each sequential undulation as a reference for this study. Figure 6 The external vertical forcing (w) is isolated by removing the balloon lift via subtracting the mean rise rate of the non-undulating portions of the flight from the rise rate at each point. Downward vertical velocities of up to 8 ms-1 are measured. Figure 9 The ozone profile for 5 Aug 2007 is shown above. Each ascent is color coded to match the ascent portions outlined in figure 5 to show the gradual increase in O3 with time during each undulation between 2 – 5 km. A crude back-of-the-envelope calculation using the ideal gas law and ozone mixing ratio changes suggests a total production of ~2×10⁶ moles. Compare with lightning estimate below. Figure 10 The change in O3 concentration with height is determined by subtracting the O3 measured at given altitude by the O3 at that same altitude in the previous undulation. dO3/dt is positive during the majority of the undulations, illustrating a local increase in O3 with time via production, transport, or both. Figure 1 Launching a balloon-borne ozonesonde unit in Las Tablas, Panamá during the NASA TC4 field campaign. are compared with analogous cases where undulations were reported. Production via Lightning Role of Water/Ice Accumulation on Balloon Lightning is a major producer of O3 via the production of NOx (Thompson et al. 1997). One flash of lightning produces an average of 1 × 1027 molecules of O3 (Minschwaner et al. 2008). Given the hourly-totaled lightning strikes within the relevant convective cell region (Figure 6), we can approximate the amount of O3 produced via lightning in moles per hour (Table 1). OBJECTIVE: Find the volume of ice or water required to make the buoyancy of the balloon neutral, assuming the balloon is a sphere. Project Overview GIVEN VARIABLES: DERIVED VARIABLES: Balloon upward force: 2.2 kg Radius of the balloon: 0.915 m Density of ice: ρ ≈ 917 kg m-3 Surface area of balloon ≈ 10.52 m2 Volume of balloon ≈ 2.4 × 10³ m2 Determine the thickness of ice or water on the balloon needed to achieve the volume of neutral buoyancy using the following derived equation for the change in radius for neutral buoyancy: layer of water Figure 11 Locations of lightning strikes detected within the hour of 1200 – 1300 UT. The turquoise balloon (centered) is the launch location of the ozonesonde. The cluster of strikes immediately to the east of the launch site were counted in the calculation in O3 (Table 1). (Above) Table 1 Lightning-induced O3 production is quantified by approximating the total number of molecules of O3 created given the hourly-totaled number of recorded lightning. These values are then converted to moles. (Below) Figure 12 The HYSPLIT back-trajectory (Draxler & Rolph, 2003; Rolph, 2003) shows the transport from the Gulf of Panamá. This justifies the increased ozone concentrations observed by the ozonesonde. SOLUTION: Δr ≈ 0.2 mm Tropical Cloud Composition and Climate Coupling (TC4) July 17 – August 13, 2007 Las Tablas, Panamá (7.8°N, 80.3°W) NASA’s Office of Earth Science IN Space Grant Consortium PROJECT: DATE: LOCATION: FUNDED BY: • 25 Ozonesondes • P, T, u, v, RH, O3 • Daily at 1800 UT • Surface to ≈ 35 km • Data available online: • physics.valpo.edu/ozone/tc4data.html 0.2 mm is a realistic thickness of water or ice condensed on the balloon, allowing the balloon to reach or surpass neutral buoyancy, supporting downward vertical motion. Figure 7 adds further support to the notion of condensed precipitation as a dominant force by the observation that the descent portions of each oscillation begins just above the freezing level. The time required for any accumulated precipitationto evaporate is justified by the time required for the phase change from ice to water preceding evaporation. Meteorological Conditions on 5 Aug 2007 Figure 2 (L) A Skew-T Log-P diagram representation of the meteorological conditions recorded by the radiosonde unit attached on the 5 Aug 2007 ozonesonde flight package. The temperature and dew point profiles indicate that the vertical extent of the atmosphere is moist and conditionally unstable below 600 mb (4km). Future Work Figure 7 This figure shows the relationship between the balloon vertical velocity and the ambient temperature. Color codes are associated with ascent and subsequent descent portions of the flight, as shown in Fig. 5 above. • Comparative studies with similar cases to test the dependence of other meteorological influences related to location, time of year and further understand the current case. • Look at the rate of transition between ascent and descent within the undulations as an indicator of the influence of precipitation accumulation versus convective downdrafts. • Examine the potential influence of ground-level anthropogenic ozone based in Panama City that may have been entrained in the inflow current of the convective cell. Role of Convective Downdrafts Figure 3 (R) Reflectivity from the NPOL radar (pictured above at right) at 1600 UT centered on Las Tablas, Panamá. The balloon is represented by the white circle at the center of the image. While undulating, the vertical velocity of the balloon reached 8 m s-1 (Figure 6), which corresponds with the largest observed vertical velocity of 7.8 m s-1 from Alder and Fenn (1979) for shallow tropical convection. The predominantly negative vertical velocities observed in figure 6 signify downdrafts as the primary vertical forcing. This is consistent with the forcing implied by the location of the balloon relative to the downdraft region associated with the shallow outflow layer (figure 8) of the convective cell (figure 3). Figure 8 A schematic diagram of the structure of convective clouds in the troposphere. Vertical motions in these layers are dominated by in-cloud heating (ωc), evaporative cooling (ωe), and radiative cooling (ωr). (Folkins and Martin 2004) Acknowledgments & References Funding to support this work came from the NASA Division of Earth Science (TC-4 Mission). Thanks to D. Lutz, B. Taubman, A. Thompson, P. Kucsera, and K. Pickering for data used in this study, and to our hosts in Panama for supporting our work. Adler, R.F., and D.D. Fenn, 1979: Thunderstorm Vertical Velocities Estimated from Satellite Data. J. Atmos. Sci., 36, 1747–1754. Draxler, R.R. and Rolph, G.D., 2003. HYSPLIT (HYbrid Single-Particle Lagrangian Integrated Trajectory) Model access via NOAA ARL READY Website (http://www.arl.noaa.gov/ready/hysplit4.html). NOAA Air Resources Laboratory, Silver Spring, MD. Folkins, I., and R.V. Martin, 2005: The Vertical Structure of Tropical Convection and Its Impact on the Budgets of Water Vapor and Ozone. J. Atmos. Sci., 62, 1560–1573. Minschwaner K., L. E. Kalnajs, M. K. Dubey, L. M. Avallone, P. C. Sawaengphokai, H. E. Edens, W. P. Winn (2008), Observation of enhanced ozone in an electrically active storm over Socorro, NM: Implications for ozone production from corona discharges, J. Geophys. Res., 113, D17208, doi:10.1029/2007JD009500. Rolph, G.D., 2003. Real-time Environmental Applications and Display sYstem (READY) Website (http://www.arl.noaa.gov/ready/hysplit4.html). NOAA Air Resources Laboratory, Silver Spring, MD. Thompson, A.M., W.K. Tao, K.E. Pickering, J.R. Scala, and J. Simpson, 1997: Tropical Deep Convection and Ozone Formation. B. Am. Meteorol. Soc., 78, 1043–1054. Figure 4 Calculated vertical divergence (10-4 s-1) based on gradients in the horizontal wind as measured by the NPOL radar. Vertical divergence can indicate locations with upward or downward vertical velocities.