Download
1 / 23
230 likes | 376 Views
Population Simulation. Jackrabbits & Coyotes. Use the macroinvertebrate data table to answer the following Qs: What is the water quality SCORE and ASSESSMENT? Would you swim in this water? Explain why or why not.

E N D
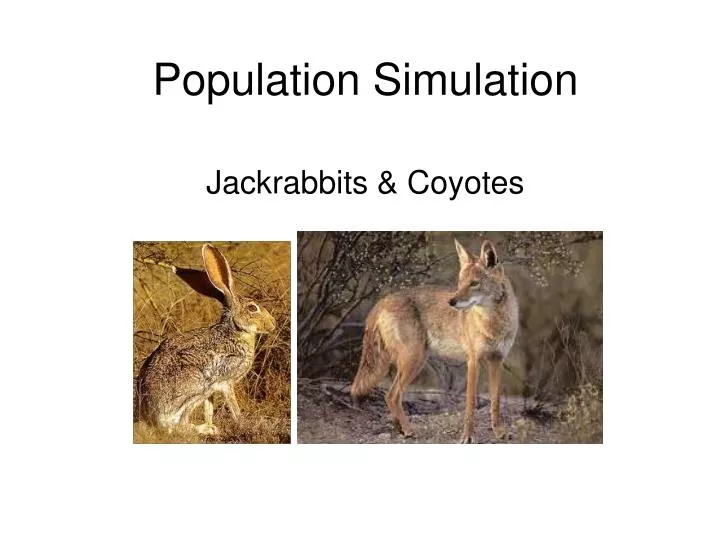
Population Simulation Jackrabbits & Coyotes
Use the macroinvertebrate data table to answer the following Qs: What is the water quality SCORE and ASSESSMENT? Would you swim in this water? Explain why or why not. Would adding POUCH SNAILS to the water make the water LESS healthy than it is now….explain why or why not? If the population of dobsonflies suddenly decreased, but the mayflies & stoneflies stayed the same, what could that mean? Bellwork 3 3 1 1 12 9 2 1 24 Excellent
Aquatic Macroinvertebrates react differently • They still exist in healthy streams! Healthy streams have everything (high diversity)! • But beware of LARGE populations of these… Midges Tubifex Worms Pouch Snails
What is the relationship between the Roadrunner & Wile E. Coyote? Describe another real life example of this kind of relationship.
Jackrabbits & Coyotes • How do you think the size of a predator population and prey population affect one another? • Write a hypothesis (if…then…as measured by…)
Procedures- in lab notebook • Spread out 3 rabbits (white) evenly across habitat (green sheet) • Hold 1 coyote (red) 1ft above lab table, & drop it once to eat. Must land on/touch a rabbit to eat it. • 0 rabbits eaten= coyote dies; 1 rabbit eaten= coyote survives; 3+ rabbits eaten=coyote reproduces (add one coyote for ea. 3 eaten) • Surviving rabbits double (reproduce) every generation • Record & calculate info @ end of each gen • Count out start #s for next gen & repeat for 18+ gens If all coyotes die: 1 new coyote immigrates in If all rabbits die: 3 new rabbits immigrate in
Example 3 1 0 3 3 1 0 0 6 1 2 4 4 0 1 0 How many rabbits must a coyote eat in one drop to reproduce?
Jobs • Jefe- Mathematician today (makes sure everything is counted & added correctly)- see me if you get to 200+ rabbits • Recorder- double checks jefe’s math before starting each round, makes sure everyone records info correctly • Materials- makes sure materials respected, put away, in charge of spreading out rabbits evenly as possible • Presenter- Measures drop distances each round, makes sure no one moves coyotes until all eaten rabbits counted & removed
Half-way Closure • What kinds of things are LIMITS to how big your jackrabbit or coyote population can grow?
Update your Ecology Divider Ecology Unit Notes Labs Assignments Tests -What is Life Notetaker -Energy Flow Notes -Trophic Levels & Rule of 10 Notes -Biome Research Notes -Biome Poster Notes -Aquatic Macroinvertebrates & Water Quality -Population Notes -Cricket Mark & Recapture Lab -Aquatic Macroinvertebrates Lab -What Is Life Quiz
Limiting Factors What kinds of factors LIMIT how big the jackrabbit & coyote populations can grow?
Limiting Factors Limiting Factors = factors that limit the growth of a population: food, water, shelter, & space
Carrying Capacity Analogy Bucket = habitat/resources Water = new births Overflow = deaths due to exceeding the carrying capacity
Carrying Capacity Carrying capacity (K) = # of individuals that the environment can support Overshoot
Graph & Conclusion • Graph how the population of jackrabbits vs coyotes change over time (think about what kind of graph this is…) • Conclusion paragraph- in lab notebook under procedures (complete sentences, separate paper)
Predator-Prey Population Graph ClosureDo on blank BWspot • Which line do you think represents the prey population? Explain why you chose it. • Which line do you think represents the predator population? Explain why you chose it. • Estimate the carrying capacity of the prey population. • In what year did the prey population overshoot the carrying capacity the most? • What does this mean about the limiting factors that year?
Predator-Prey Population Graph Closure • Which line do you think represents the prey population? Explain why you chose it. • Which line do you think represents the predator population? Explain why you chose it. • Estimate the carrying capacity of the prey population. • In what year did the prey population overshoot the carrying capacity the most? • What does this mean about the limiting factors that year? Green line, b/c bigger population Red, b/c smaller population 40 to 60 1865 There must have been lots of grass (or whatever prey feeds on), water, space, etc.
Hunting permits are frequently issued to help control certain populations of animals. When would a state want to issue a LOT of permits for deer hunting? How could this affect the wolf population in the area? Are deersautotrophs or heterotrophs? What about wolves? Explain your answers. Sponge: Think about it…