Download
1 / 27
270 likes | 398 Views
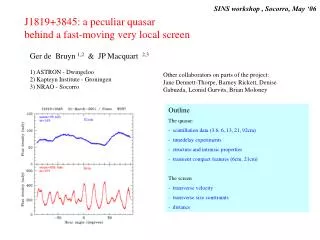
SINS workshop , Socorro, May ‘06. J1819+3845: a peculiar quasar behind a fast-moving very local screen. Ger de Bruyn 1,2 & JP Macquart 2,3 1) ASTRON - Dwingeloo 2) Kapteyn Institute - Groningen 3) NRAO - Socorro.

E N D
SINS workshop , Socorro, May ‘06 J1819+3845: a peculiar quasar behind a fast-moving very local screen Ger de Bruyn 1,2 & JP Macquart 2,31) ASTRON - Dwingeloo 2) Kapteyn Institute - Groningen3) NRAO - Socorro Other collaborators on parts of the project: Jane Dennett-Thorpe, Barney Rickett, Denise Gabuzda, Leonid Gurvits, Brian Moloney • Outline • The quasar: • scintillation data (3.6, 6, 13, 21, 92cm) • timedelay experiments • structure and intrinsic properties • transient compact features (6cm, 21cm) • The screen • transverse velocity • transverse size constraints • - distance
J1819+3845 & WSRT : a 7 year relationship (~1000 hrs observing) • The first three years Dennett-Thorpe & de Bruyn (‘00,’01,’03) - time delay, anisotropy - screen distance, velocity - angular size, Tb and basic quasar core-jet structure • The next four years Macquart & de Bruyn (’05,’06) de Bruyn & Macquart (in prep), others ... - spectrum and long term source evolution (3.6, 6, 13cm) - 21cm diffractive scintillation - differential polarization imaging - unexpected recent 6cm developments - VLBI imaging
J1819+3845: a ~21m quasar at z=0.55 peaking at 30-40 GHz Peaking around 40-50 GHz in 1999!
Variability through the seasons (1999/2002): a sample of early lightcurves
scintillation timescale during the year(s) (>factor 10 range !) Blue dotted line assumes Vscreen= 0 km/s (NB: ecliptic latitude ~ 62o hence’uniformly’ sensitive to transverse motion) Red line Vscreen ~ 30 km/s STILL VERY POOR FIT in slow season !
….but excellent fit with anisotropic scintels (14:1) in PA ~ 85o ~Nov 20
The ‘effective’ transverse velocity is very small andparallel to scintles around Nov 15-25 ! This ‘stationarity’ is indeed observed in runs on 17-Nov-02 and 13-Nov-04 !! Simultaneous split-array (5+4+5 telescopes) observations 2.3, 4.9 and 8.5 GHz
Dennett-Thorpe & de Bruyn, 2002 Variable timedelay of ~ 100 seconds proof of scintillation ! 7 Jan 2001
However, the velocity solution is degenerate in (VRA,VDec) for very anisotropic turbulence 1 February
The ‘preferred’ velocity solution implies Jan-March motion perpendicular to the very elongated scintels (~100,000 x 1000,000 km) Barney Rickett, (priv comm)
DennettThorpe & deBruyn, 2003 Summary of Tb – size and distance – CN2 dependencies Best estimate: distance ~ 4-12 pc Angular size 100-300 arcsec Tb~ 1011.5-12 K
Summary of 7 years of monitoring : a slowly evolving AGN outburst All short-term variations probably due to scintillation: i.e. external except 1-April-02 !? 3 highest 6cm peaks in 7 years all within 12h !
New extremely fast variations appear in 2004 and 2005. They appear to come and go on ~ 1-2 month timescales. Probably intrinsic
Power spectra at 6cm in Feb 00, 03, 04, 05 Note the appearance of extra peaks at log (rad/s) ~ 10-2 and 10-2.3
Polarization monitoring at 6cm: allowing differential I-Q/U/V imaging at the ~10 arcsec level !! • Interpretation/analysis based on: • core-jet structure of radio source • opaque synchrotron selfabsorbed core at 6cm /5 GHz (at least till 2006) • highly polarized features, slowly changing, in jet • time delay varies with season: T (I - Q/U) is always +ve (from >4h - 0.9h) • Interesting from AGN physics point of view BUT • realization that this made possible a ‘direct’ distance measurement of the scattering screen • from VLBI-size + (I - Q/U) time delay ! • (work in progress with Denise Gabuzda, Brian Moloney and Leonid Gurvits)
The ‘polarization fun’ really started in summer 2002 I Q U V ~ 5 mJy polarized flux
Beautiful series of I,Q,U,V variations in winter/spring 05/06 22 Jan 2006 Frozen screen turbulence on >>hours timescale I - Q/U time delay varies still smoothly from >4h to ~ 55m In spring 2006 there appears only one single dominant Q and U feature
6cm temporal asymmetries and consistent 3.6-6cm delay --> core-jet with SSA-opacity effects influencing centroid position time-delay between 8.4 GHz and 5 GHz ‘centroids’ is about 20m in the spring season
Gabuzda, Moloney etal, in prep 8 GHz VLBI image 4-Jun-03 N-S displacement I - Q/U about 600 arcsec at 8.4 GHz
Deriving the distance of the scattering screen to J1819+3845 Q 5 GHz (& 8.4 GHz ?) U 5 GHz (& 8.4 GHz ?) T 55m VLBI separation at 8.4 GHz ~ 600 arcsec I 5 GHz T 20m I 8.4 GHz • = (55m+20m) x 30 km/s = 1.4 1010 cm / Dscreen = 600 / 2.06 1011 Dscreen 4.9 1018 cm = 1.6 1 pc !!
A final useful constraint on the screen properties comes from (a dozen) widefield WSRT 21cm observations 1.25o x 1.25o field 200 sources S21cm > 100 Jy Several ‘flat’ spectrum sources (quasars) with fluxdensities of about 1-20 mJy within 0.5o of J1819+3845 Because S = 2kTb 2/2 (S /Tb)0.5 All things being equal: faint sources should show stronger scintillations !! However, they only show weak (m < 5%) ‘flux flickering’ at 6/21cm. transverse screen size probably less than 0.5o to be continued
Derived properties of the screen: 1) VLBI-size angular size + (I - Q/U) time delay (& 10m timescale Fresnel scale at 6cm ?) 2) Scintillation timedelay and seasonal variations 3) Scintillation seen for 7 years in which screen moved 7 years x 35 km/s Surrounding compact sources within 0.5o show little or no scintillations • distance ~ 2 pc (~ 1019 cm) • Vtransverse relative to Sun ~ 35 km/s • transverse dimensions > 1015 cm • transverse dimensions < 1017 cm (0.01 x 1019 cm) Distance from ~ 20-30 pc to 4-12 pc to ~ 2 pc Edge of Local Bubble ? Vega (Lyrae) ? edge LIC, Mic clouds ? Bhat et al (1998) d=8.4 pc, 3o away Linsky (SINS, yesterday)
Line of sight to J1819+3845 crosses the edge of the local bubble at about 30 pc distance Bhat et al 1998
Screen properties distance ~ 2 pc 1015 cm < Dtransverse < 1017 cm ‘thin’ ? (anisotropic turbulence) Vtrans ~ 35 km/s associated with ?? density, temperature, pressure ?? (excess RM <50 rad/m2) AGN properties Core-jet 50 - 500 arcsec (0.2 - 2 pc) Non-moving/expanding nozzle ? Tb 1012 K , i.e. NOT very ‘hot’ Complex polarized jet, not moving ? Transient compact components in 2004/05 (located where ?) Very compact features also at 21cm (DISS) Unusual source: no extended structure, young ?? J1819+3845 and its ‘screen’Concluding: we are finally closing in (after 7 years !)