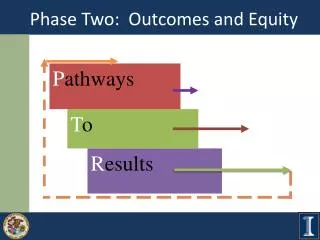
Outcomes and Equity Assessment Phase
240 likes | 354 Views
This phase focuses on understanding student demographics, addressing equity gaps, and analyzing outcomes for educational improvement. It involves selecting outcomes, collecting and sharing data, and interpreting findings to set short- and long-term goals.

Outcomes and Equity Assessment Phase
E N D
Presentation Transcript
“A valuable aspect of the process was collecting and reviewing the data to truly understand who the students are that enroll in our programs and perhaps more importantly, who they are not.” -PTR Team Member, Kaskaskia College Partnership
Purpose and Goals • To identify, collect, and interpret outcomes by student group. 2. To use PTR equity concepts when analyzing student data 3. To identify equity gaps.
Why Equity? • Demographics are changing • Educational pipeline is leaking • Disparities in outcomes exist and are growing among student groups • Equity gaps must be addressed to improve the P-20 educational system
Three Steps of Phase Two Step 1: Outcomes and Equity Selection Step 2: Data Collection and Sharing Step 3: Data Analysis and Interpretation
Equity Gaps Close gaps by… Race/ethnicity Gender Age Socioeconomic Status (SES) English Literacy Special populations (Perkins) Other defining characteristics
Step 1 Outcomes and equity selection • Select student outcomes from Outcomes Menu • Determine definitions • Student characteristics • Determine how to obtain the data
Step 2 Data collection and sharing by the PTR team: Complete Outcomes and Equity Templates and share with individual team members Individuals Review the templates Individuals Complete Data Review Worksheet
Program Level vs. Institutional Level DataCredit hours earned to attempted rate
Step 3 Data analysis and interpretation by the team: • Discuss Data Review Worksheet • Review and Refine problem(s) description • Develop short- and long-term goals to complete the Charter
Step 3 – Example Interpretation Findings: Fall-to-Spring Retention in Program of Study Race/Ethnicity/Gender • Low retention rate (40%) overall. • White students account for a majority of the overall population.The team is concerned that there are very few students of color enrolled in the POS. • Female students had a higher retention rate (63%) than male students (34%) Special Populations • Economically disadvantaged students are retained better (53%) compared to all students in the POS (40%). • Nontraditional age students were retained at only 15%, much lower than all students.
However, the data indicated that our retention, particularly of minorities and female students, was not that great.” - PTR Team Member, Kishwaukee College Partnership “The most ‘significant’ part of the PTR process for me was the meeting where we reviewed the data. I had assumed we were doing a good job with retention...
OCCRL Resource Webpage This link takes you to tools and support materials that your team needs to complete this phase. http://occrl.illinois.edu/projects/pathways/resources-for-ptr-teams/
References and Resources Achieving The Dream. (2011). Retrieved from http://www.achievingthedream.org/ Bauman, G.L., Bustillos, L.T., & Bensimon, E.M. (2005). Achieving equitable educational outcomes with all students: The institution’s roles and responsibilities. Association of American Colleges and Universities. Retrieved from http://www.aacu.org/inclusive_excellence/documents/bauman_et_al.pdf Dowd, A.C. (2005) Data don’t drive: Building a practioners-driven culture of inquiry to assess community college performance. Retrieved from http://www.achievingthedream.org/images/_index03/datadontdrive2005.pdf Hurtado, S. (2007). Linking diversity with the educational and civic missions of higher education. Review of Higher Education, 30(2), 185-196.
OCCRL • OCCRL – e-mail: occrl@illinois.edu • PH: 217-244-9390 • OCCRL Website: http://occrl.illinois.edu • PTR Website: http://occrl.illinois.edu/projects/pathways