Download

1 / 20
200 likes | 302 Views
Cotton Research. Oklahoma State University. Exp. 439, Altus OK 1972-2006. Exp. 439, Altus OK 1972-2006. Exp. 439, Altus OK 1972-2006. N Rate Algorithm Trial. Location: Lake Carl Blackwell Plot Size: 20 x 10’ Alley width: 5’ Total area: 95 x 150 Planting Date: May 15, 2006

E N D
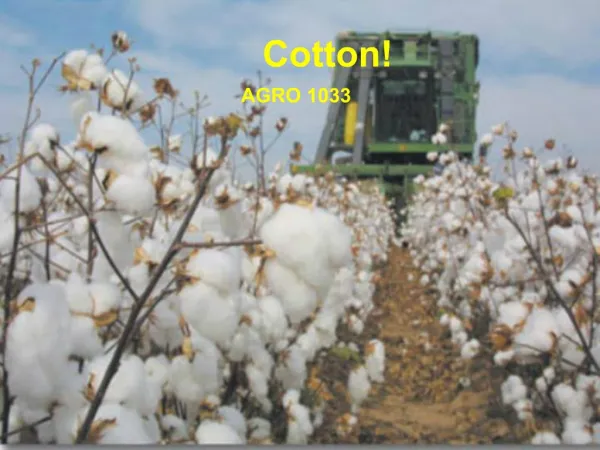
Cotton Research Oklahoma State University
N Rate Algorithm Trial • Location: Lake Carl Blackwell • Plot Size: 20 x 10’ • Alley width: 5’ • Total area: 95 x 150 • Planting Date: May 15, 2006 • Harvest Date: October 9, 2006 • Fertilizer P applied preplant and incorporated, 30 lb P2O5/ac as 0-46-0 • Tillage: 2 disc’s preplant followed by a rolling coulter
N Rate Algorithm Trial • Variety: Monsanto NG3273B2RF • The Cotton Variety was NexGen 3273B2RF. It is a stacked trait variety with Roundup-Ready Flex (allows for multiple applications of Round-up throughout the growing season) and Bollgard 2 (newest Bt product for cotton). NexGen cotton varieties are stripper varieties
If too much N has been applied what are the visible indicators? • Delayed maturity • Compared to zero-N plots • Leaf N will be higher in the over-fertilized plots
If not enough N has been applied, and more is needed mid-season,what should we look for? • Leaf N < 90-95 % of over-fertilized plots or strips. • New fruits can shed • Developing bolls will be smaller
What to do? ENVIRONMENT ? • Zero-N Strip • Farmer Practice • Nitrogen Rich Strip • N management in Texas and Oklahoma is too N rich.
Improved Mid-Season N Management • Can we estimate RI in cotton similar to wheat and corn? • Can we estimate yield potential and use a YP0 * RI algorithm approach? • The Ramp Calibration Strip should help us to define optimum N rates and to avoid excessive vegetative growth
N Management • Preplant Soil Test 0-24” • Dryland: 30-50 lb N/acre • Irrigated: 60 lb N/bale of yield goal • Mid-season N (June, 1st square) • Use of N Rich and 0-N (visual) • Last N Applied (peak bloom)
Sensor Based N Algorithm • On-off based on vegetative Green optimum and coverage threshold • On-off decision of “if/then, and/or” for N or growth regulator • To start, these decision tools need to be simple (yes/no). Management zones, (high-med-low) approaches can come later.