Geomagnetic Data Analysis of Significant Solar Events: Insights from 2003 to 2011
200 likes | 339 Views
This study examines notable geomagnetic events from 2003 to 2011, focusing on their impact on Earth's magnetic field and auroral activity. It highlights the rapid development of geomagnetic disturbances during the Halloween event in 2003 and the isolated southward IMF propagation observed on November 8, 2000. The low solar activity since 2004 is correlated with Kp index values, showing non-linear trends. Results from Kiruna and other geomagnetic stations reveal unique signatures during these events, contributing valuable insights into long-term solar cycle variations and their terrestrial effects.

Geomagnetic Data Analysis of Significant Solar Events: Insights from 2003 to 2011
E N D
Presentation Transcript
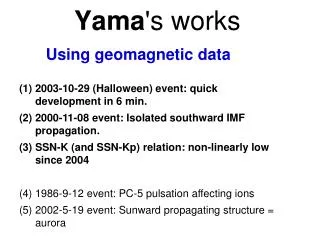
Yama's works Using geomagnetic data 2003-10-29 (Halloween) event: quick development in 6 min. 2000-11-08 event: Isolated southward IMF propagation. SSN-K (and SSN-Kp) relation: non-linearly low since 2004 1986-9-12 event: PC-5 pulsation affecting ions 2002-5-19 event: Sunward propagating structure = aurora
2003-10-29 event => SW = 2000 km/s
0611:40 UT 0615:40 UT Ground ∆B + auroral image evening-midnight IQA≈01 LT 0613:40 UT morning 0617:40 UT
Extremely low solar activity since last solar minimun Effect on the Earth? (SCOSTEP VarSITI program) Kiruna (65° GMLat) K index during the current maximum #24 (2011~) is nearly the same as values at solar minimums. note: 21-24 UT means 22-01 LT, and magnetic midnight sector when aurora activity causes large K. 5
SSN – Kp (subdivided by different phases) Min Incl. Max Decl. 1. Each solar cycle must be subdivided by different phases (because the solar wind condition is different for the same SSN) 2. Kp since 2004 are the lowest for the same SSN 6
Reconstruct Kp from SSN (note: subdivide by different phases) ⇒ reconstruct within standard deviation except the recent 10 years. ⇒ change from 2004 is clear 7
“Chance of minor storm@high-latitude” by NOAA vs. observed Kp (Anna Larsson, high-school student project) % of observed Kp (largest of the day) For the same prediction, Kp values are (model is different between 2000 ⇔ 2011): 2011-2012 < 2007-2008 & 2000-2001 < 2003-2004 8
2000-11-08 event Unique IMF Bz=+10 nT -3 nT +10 nT change Only once in 50 year’s Kiruna data (examined all data from 1954) All polar geomagnetic stations showed similar signature, propagating tailward with the solar wind velocity Presented at EGS 2001 (EGU = EGS + EUG), but could not publish because I got sick when I finished analyses
Kiruna X Y Z AU AL
1986-9-12 event Finland = conjugate + online Kiruna = only analogue data Viking conjugate
overview ions > 5000 km/s ions ≈ 3000 km/s P/A 0.01~40 keV P/A 06:42 06:44 06:46 06:48 IMAGE (FUV)
AE and Bx Main phase of minor storm (Dst ~ -60 nT). 2. Substorm onset at around 06:25 UT but ceased in ~10 min. 3. New activity started at around 06:38 UT. 4. Aurora bulge arrived Cluster’s conjugate ~19 MLT at around 06:42~06:44 UT.
sunward propagation 1000~2000 km