Download

1 / 52
520 likes | 700 Views
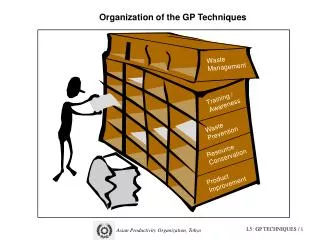
GIS Integrated Analytics for Preventive Maintenance and Storm Response . Presenter: John Lauletta, CEO/CTO Sr. Member, IEEE. Preventive Maintenance Decision Process. Budget. Circuit Performance. Non Storm-Related Outages on the Electric Distribution System. Equipment Failure 31 %.

E N D
GIS Integrated Analytics for Preventive Maintenance and Storm Response Presenter: John Lauletta, CEO/CTO Sr. Member, IEEE
Preventive Maintenance Decision Process Budget Circuit Performance
Non Storm-Related Outages on the Electric Distribution System Equipment Failure 31% Trees / Vegetation 32% Miscellaneous 19% Animal Contact 18% Source: U.S. DOE
Preventive Maintenance Decision Process PREDICTIVE (PdM) Budget Circuit Performance Optimized Maintenance Grid Design Asset Health Connectivity Vegetation Mgmt.
Predictive Maintenance (PdM) RF Emission Detection Ultrasonic Emission Detection Infrared Detection Predictive Maintenance is based upon knowing the condition of equipment in a system. Predictive Maintenance means using technologies that tell us what will fail in the future, not what is failing right now. Predictions come from monitoring the condition of equipment as it is operating. Visual Detection Here are some ways to measure equipment condition. There are many benefits to conditions-based maintenance including lowering cost, improving system performance and enhancing worker safety. But, how can the condition of all the equipment on the grid be measured? Measuring the Condition of the Grid
Exacter, Inc. Provides: Grid Condition Assessment for Improved System Resiliency and Reliability • Based in Columbus, OH • US Strategic Partners: • Int’l Alliance Partners • Australia, Mexico, Canada • 2 US Patents, 7 Int’l Patents • 2 million+ Poles Surveyed • 3rd Party Validation • U.S. Dept. of Energy (DOE) • Nat’l Elec. Testing Lab (NETL) • The Ohio State University
Research FacilitiesThe Ohio State University High Voltage Laboratory Initial Research 2004 to 2006 Advanced Research Coninues
Test Fixtures Surge Arrester Being Studied Two views of the test setup
Lab Workstation Faraday Cage Research Analytics EXACTER® Sensor
Exacter Acquisition and Analysis Process Data Acquisition & Discrimination Actionable Information Data Analysis • Data analyzed for severity, persistence and prevalence, enabling: • Exact locating of failing component • Replacement prioritization RF emissions from arcing (deteriorated) electrical components Exacter sensor in vehicle/aircraft collects the signals and then discriminates and GPS locates arcing, tracking and leaking electrical components Precise GPS coordinates and relevant condition-data transmitted to servers for final statistical geospatial analysis Reports and GIS compatible information provided to customer
The Need: DOE Smart Grid Project Example http://www.smartgrid.gov/reports
Condition Assessment:Select Circuits and Design Survey Following the selection of circuits to be included in the assessment, Exacter Data Specialists design specific survey routes using public access roadways. The EXACTER Sensor is sensitive in a 200 meter radius from the vehicle.
Condition Assessment:Monitor Survey Progress Survey Quality Control While the survey is underway, the path of the survey vehicle, the WHITE trace, is monitored to insure that the circuits being assessed are completely studied. Accuracy of results is improved by multiple passes of the same route over a four week period.
Condition Assessment:Real-time Failure Signature Analysis Whenever the EXACTER Sensor locates a line emission that correlates to a Failure Signature a real-time study is completed. The 986 RED markers show all of the studies from the four-week survey process.
Condition Assessment:EXACTER Condition Assessment Results The 986 RED Failure Signature Events are studied by EXACTER Servers to create this result: 25 BLUEMaintenance Groups where a structure includes at least one weakened component.
Internal Algorithms: Geographic Circle Calculation • Calculates coordinates of a circle which is centered about a point on the globe • Difficult cone-sphere intersection problem • Adopted a method described in The Journal of Applied Meteorology by I. Ruff in 1971
Transmission Equipment Deterioration Aerial Surveys
Prioritized Maintenance Action:Select Equipment to Replace Specific component(s) that are arcing, leaking or tracking on those structures that have been prioritized for repair are identified. Photographs, Maps, Reports, and GIS Files are provided. GIS .SHP File
Example: Project Design • Projects are designed with utility data to create an optimized price/benefit result • Utilities: • Set Goals • Perform Maintenance • Measure Results Predictive Based Maintenance
Example: Prioritized Worst Performing Circuit (WPC) Improvement Program 73% of Total CMI – 1,904 miles (32%) CMI Result of Current Programs
Sum of All Customer Interruption DurationsTotal Number of Customers Served SAIDI IEEE 1366 71.18 63.92 61.33 23.38 Aggregate Customer Experience
Total # of Customer InterruptionsTotal Number of Customers Served SAIFI 1.53 1.52 1.48 1.03 Aggregate Customer Experience
Sum of All Customer Interruptions Total Number of Customer Interruptions CAIDI Relatively No Change in the Customer Experience 46.73 41.90 41.32 22.78 Aggregate Customer Experience
Non Storm-Related Outages on the Electric Distribution System Equipment Failure 31% Trees / Vegetation 32% Miscellaneous 19% Animal Contact 18% Source: U.S. DOE
Typical Strategies Automat ion 60% – 70% Out of ROW Tree Trimming
Replace Deteriorated Equipment Automat ion Predictive Equipment Maintenance Tree Trimming
What is The Strategy to Improve?How Good Is Good Enough? • SAIDI (CMI) • SAIFI (Number of outages) • CAIDI (CMI) • CEMI (Number of outages) • Targeted Performance: 1st Quartile or Decile • Stay Ahead of the Bear
Informed Maintenance Decisions CMI (100,000)
Optimized Selection CMI (100,000)
Circuit Connectivity Circuit 1 1,000 Customers CMI1 = CMI2 Circuit 2 120 Customers
Circuit Physical Design Circuit 1 9 miles of OH 1 mile of UG CMI1 = CMI2 9 miles of UG 1 mile of OH Circuit 2
Circuit Critical Connectivity Circuit 1 100 Customers CMI1 = CMI2 Circuit 2 100 Customers
Grid Operation Importance Circuit 1 Smart Grid Control element CMI1 = CMI2 Circuit 2 Residential Distribution
Preventive Maintenance Decision Process Budget Circuit Performance
Preventive Maintenance Customer Complaints
Improved Measurements Effective Results Lift Opportunity To Lower O&M Expense
Preventive Maintenance Decision Process PREDICTIVE (PdM) Budget Circuit Performance Optimized Maintenance Grid Design Asset Health Critical Load Connectivity
Optimized Maintenance Vision Analytics
Deteriorated Equipment Impact on Grid Resiliency • 1. THE GRID IS OLD—AND IT'S ONLY MAKING MATTERS WORSE • According to the DOE report: "70% of the grid’s transmission lines and power transformers are now over 25 years old and the average age of power plants is over 30 years." • As a result, "the age of the grid’s components has contributed to an increased incidence of weather-related power outages.“ • . . . Utility Dive
Storm Influence on Transmission http://nca2009.globalchange.gov/significant-weather-related-us-electric-grid-disturbances