Download
1 / 1
10 likes | 172 Views
a. b. a. b. RADIAL BASIS FUNCTIONS FITTING METHODS AND SMOOTH PIECEWISE ALGEBRAIC APPROXIMATION AS APPLIED TO DETERMINE POSTGLACIAL TILT IN THE CANADIAN PRAIRIES. Azadeh Koohzare, Petr Van íč ek and Marcelo Santos.

E N D
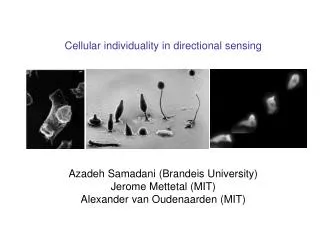
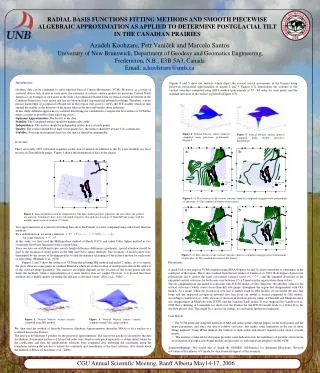
a b a b RADIAL BASIS FUNCTIONS FITTING METHODS AND SMOOTH PIECEWISE ALGEBRAIC APPROXIMATION AS APPLIED TO DETERMINE POSTGLACIAL TILT IN THE CANADIAN PRAIRIES Azadeh Koohzare, Petr Vaníček and Marcelo Santos University of New Brunswick, Department of Geodesy and Geomatics Engineering, Fredericton, N.B., E3B 5A3, Canada Email: a.koohzare@unb.ca Introduction: Geodetic data can be combined to yield adjusted Vertical Crustal Movements (VCM). However, as a result of scattered data or lack of data in some areas, the estimates of velocity surface models are uncertain. Central North America is an example of such areas in the study of postglacial rebound. Data on vertical crustal movement in the Canadian Prairies has been sparse and has not been included in postglacial rebound modeling. Therefore, a more precise knowledge of postglacial rebound tilt in this region will assist to verify the ICE models which in turn expand the studies of the histories of the major lakes in the area and benefit shore industries. In this study, different approaches to scattered data fitting are considered to compute the best surface of VCM that meets as many as possible of the following goals: Optimum Approximation: The best fit to the data Stability: The Computed surface should be numerically stable. Independency: The surface should be independent of the choice of node points. Quality: The surface should be of high visual quality(i.e., the surface should be at least C(1)-continuous) Usability: For large real regional data sets, the surface should be manageable. Figures 4 and 5 show the surfaces which depict the vertical crustal movements in the Prairies using piecewise polynomial approximation of degree 2 and 3. Figures 6,7a demonstrate the contours of the vertical velocities computed using SPAA method (polynomials of 2nd, 3rd order for each patch) and the standard deviation of the surface is plotted in Figure 6,7b. Figure 4: Vertical Velocity surface (mm/yr) computed using piecewise polynomials, Degree 2. Figure 5: Vertical Velocity surface (mm/yr) computed using bicubic piecewise polynomials. Overview: There are totally 2287 relevelled segments in the area of interest in addition to the 63 years monthly sea level records of Churchill tide gauge. Figure 1 shows the distribution of data in the region. Figure 6: (a) The contours of the vertical velocities (mm/yr) computed using piecewise polynomials of 2nd order. (b) The standard deviation of the surface. Figure 1: Data distribution used in computations. The blue shaded polygon represents the area where the patches are selected. Continuous lines show relevelled segments. Star indicates location of Churchill tide gauge with the monthly mean sea level trend of 9.5 mm/a . Two approximations of scattered relevelling data set in the Prairies was first computed using radial basis function methods. By a radial function, we mean a function for some function In this study, we first, used the Multiquadrics method of Hardy (1971) and radial Cubic Spline method as two commonly used basis function for the scattered data. Since our data are of different types, mostly height difference differences (gradients), special attention should be paid to the location of nodal points in the MQ and Cubic spline methods. The locations of nodal points were determined by the review of leveling profiles to find the maxima ad minima of the relative motion for each route of relevelling. (Holdahl, et al., 1978) Figures 2 and 3 show the surfaces of VCM produced using MQ method and radial C spline. As it is seen in the plots, there are some peaks in southern Manitoba which are in the location of nodal points and are the artifacts of the constant shape parameter. The surfaces are highly depends on the location of the nodal points and this limits the methods, when a representation of a some relative data are sought. However, it is proved that these methods are of highly quality for fitting the surfaces to absolute values. (Dyn, et al., 1986) Figure 7: (a) The contours of the vertical velocities (mm/yr) computed using piecewise polynomials of 3rd order. (b) The standard deviation of the surface. • Discussion: • A quick look at the maps of VCM compiled using SPAA (Figures 6a and 7a) shows that there is subsidence in the south part of the region. This is also resulted from the last studies of Carrera et al. 1991. Both degree of piecewise polynomials led to almost the same a posteriori variance factor ( ) and the standard deviations of the estimated vertical velocities for both cases vary between 0.5-1.5 mm/yr in the region where there is data. • The tilt computed from our model is consistent with ICE-3G model of GIA, However, the absolute value for the vertical velocities (which comes from Churchill tide gauge) throughout the region has disagreement with GIA models. As a result, while the location of zero line is further south in GIA models, in our model the zero line loops and the suspected postglacial rebound zero line from our model is biased compared to GIA models. According to Lambert et al., 1998, the rate of decrease in absolute gravity values at Churchill and Manitoba show also disagreement in Manitoba with ICE3G and the standard Earth model. It was suggested by Lambert et al., 1998 that a thinning of Laurentide ice-sheet over the Prairies for the ICE-3G model leads to a better fit to the absolute gravity data. This might be a case in our studies, too and needs further investigations. • Conclusion: • The VCM generated using the methods of MQ and radial splines depend largely on the node points and the shape parameters, and since our data is relative velocities, this makes some limitations in the use of those fitting methods. Using SPAA method, the solution is quite stable and doesn’t depend on the choice of node points. • The analysis conducted for this paper provides some indication into the usefulness of geodetic observations in evaluation of postglacial rebound models and provides us with important insight to model VCM. • Acknowledgment:We would like to thank the GEOIDE (GEOmatics for Informed DEcisions) Networkof Centres of Excellence of Canada for their financial support of this research. Figure 2: Vertical Velocity surface (mm/yr) computed using MQ method. Figure 3: Vertical Velocity surface (mm/yr) computed using Cubic spline method. We, then used the method of Smooth Piecewise Algebraic Approximation (hereafter SPAA) to fit a surface to a scattered data in the Prairies. The area was divided into 6 patches for the piecewise approximation. The size of the patches is dictated by the data distribution. Polynomial surfaces of 2d and 3rd order were fitted to each patch separately to obtain initial values for the coefficients and then the simultaneous solutions were computed after enforcing the constraints along the boundaries between the patches to satisfy the continuity and smoothness of the final solutions. (For details about the method of SPAA see Koohzare et al., 2006). CGU Annual Scientific Meeting, Banff Alberta May14-17, 2006