Download
1 / 25
250 likes | 418 Views
Actionable Knowledge Discovery for Threats Intelligence Support ~ A Multi-Dimensional Data Mining Methodology. Olivier Thonnard Royal Military Academy Polytechnic Faculty Belgium olivier.thonnard@rma.ac.be. Marc Dacier Symantec Research Labs Sophia Antipolis France

E N D
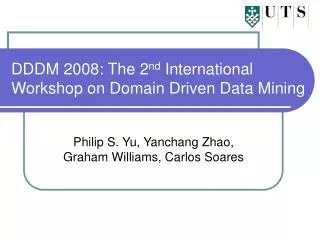
Actionable Knowledge Discoveryfor Threats Intelligence Support~A Multi-Dimensional Data Mining Methodology Olivier Thonnard Royal Military Academy Polytechnic Faculty Belgium olivier.thonnard@rma.ac.be Marc Dacier Symantec Research Labs Sophia Antipolis France marc_dacier@symantec.com 2nd Int. Workshop on Domain Driven Data Mining Pisa - Dec 15th, 2008
Outline • Introduction • A multi-dimensional & domain-driven approach for mining network traffic (eg malicious) • Experimental environment • A real-world example • Conclusions
Introduction • According to the security community, today’s cybercriminality: • Is increasingly organized • Involves the commoditization of various activities : • By selling 0-days and new (undetected) malwares • By selling /renting compromised hosts or entire botnets • Seems to be specialized in certain countries • Coordination patterns …
Threats intelligence • What is the prevalence of emerging coordinated malicious activities? • Which countries / IP blocks seem to be more affected? • Can we observe various “communities” of machines coordinating their efforts? • How to discover knowledge about: • The modus operandi of attack phenomena • The underlying root causes of attacks • How to analyze Internet threats from a global strategic level? • Can we enable some sort of Internet threat “situational awareness”
Our « multi-dimensional KDD » approach to analyze network threats • Collect real-world attack traces from a number of (worldwide) distributed sensors • Network of honeypots = “Honeynet” • Threats analysis (semi-automated): • Collect “attack events” from each sensor • Multi-dimensional KDD: • Extract relevant nuggets of knowledge DDDM (with expert-defined features ) • Using Clique algorithms (clique-based clustering) extraction of maximal weighted cliques • Synthesizing those pieces of knowledge, to create “concepts” describing the attack phenomena • Using Cliques combinations DDDM
+/- 40 sensors, 30 countries, 5 continents Leurré.com Project
Leurre.com / SGNET Honeynet • Global distributed honeynet (http://www.leurrecom.org) • +50 sensors distributed in more than 30 countries worldwide • Ongoing effort of EURECOM since 2003 • Same configuration for all sensors : • (V1.0): low-interaction honeypots based on honeyd • (V2.0) : high-interaction honeypots based on ScriptGen • Data enrichment: • Dataset enriched with contextual information: • Geo, reverse-DNS, ASN, external blacklists (SpamHaus, Shadowserver, Dshield, EmergingThreats, etc) • Parsed and uploaded into an Oracle DB • All partners have full access (for free) to the whole DB
Research contextWOMBAT • Worldwide Observatory of Malicious Behaviors And Threats • EU-FP7 project ( http://www.wombat-project.eu ) • Joint effort in collecting, sharing and analyzing data on global Internet threats
Definition 1: Attack profiles • In our honeynet: • A source = an IP address that targets a honeypot platform on a given day, with a certain port sequence. • All sources are clustered into “attack (profiles)” based on certain network characteristics(*): • targeted port sequence, • #packets, • attack duration, • packet payload, • … Attack tool Fingerprint(s) (*) F. Pouget, M. Dacier, Honeypot-Based Forensics. AusCERT Asia Pacific Information technology Security Conference 2004.
Definition 2: Attack event on sensor ‘x’ Event 1 Event 2 Event 3
Dimensions usedto create “attack cliques” • We need to identify salient features for the creation of meaningful cliques (“viewpoints“) • expert-defined characteristics for each dimension • Geolocation • Botnets located in specific regions • So-called “safe harbors” for the hackers • IP netblocks / ISP’s of origin • Bias in worm propagation (e.g. malware coding strategies) • “Uncleanliness” of certain networks (e.g. clusters of zombie machines) • Many others • Time series • Synchronized activities targeting different sensors • Targeted sensors Remark: distance used for distributions Kullback-Leibler, Chi-2, and Kolmogorov-Smirnov
+ time time time Cliques combination:Creating multi-dimensional “concepts” Geographical cliques of attack events Temporal cliques of attack events Dimension 2-concept Remark: for each dimension, we extract maximal weighted cliques using the « dominant sets » approximation (! needs a full similarity matrix)
Dynamic creation of Concept lattices Initial set of attack events Cliques = D1-concepts Dimensional Level D2-concepts D3-concepts D4-concept
Some experiments • Some analysis details: • Timeframe: Sep 2006 June 2008 • Network traffic volume : 282,363 IP sources (grouped into 351 attack events) • Nr of targeted sensors: 36 • In 20 different countries, 18 different subnets • 136 different attack profiles (i.e. attack clusters)
Visualizing Cliquesusing Multi-dimensional Scaling • High-dimensionaldatasetLow-dimensionalmapretaining the global and local structure • ‘Dimensionalityreduction’ • Build a matrixwith e.g.: • Rows= attackevents • Columns = featurevectors • Example : Geolocationvector of 226 country variables • MDS techniques • Linear PCA • Non-linear Sammonmapping, Isomap, LLE, (t-)SNE
Visualizing Cliquesusing MDS and Country labels Clique number
Combining Cliques: Real-world example Attackevents {1,2,3,…,67} Botnet scans on ports: I, I-445T, I-445T-139T, I-445T-80T Cliques of Time series ts1 ts6 ts4 ts2 time p7 Platform cliques Dimension superclique g1 Geo cliques g12 g16 g32 g9 g3 Only scanners ! (ICMP) Onlyattackers! (I-445T-139T…) Subnets cliques s12 s19 s4 s26 s28 s30 s2 s24
Visualizing Cliquesusing Multi-dimensional Scaling attackers Clique number scanners
Real-world example: Botnet attack waves • Inferred facts: • Different waves in time • Those 4 botnet waves have hit the same group of platforms • Dynamic evolution of the botnet population (IP blocks) between each attack wave • Separation of attackers and scanners
Scanners vs Attackers … Scanning bots Attacking bots
Conclusions • This KDD methodology can produce concise, high-level summaries of attack traffic: • Attack cliques deliver insights into global attack phenomena • Facilitates the interpretation of traffic correlations: • Attack concepts are rich in semantic • It helps to uncover certain modus operandi • Flexible and open to additional correlation « viewpoints »: • New clique dimension can be added easily when experts find it relevant (i.e. domain-driven)
Future work • Integration of other relevant attack features: • Botnet / worm patterns separation • Malware characteristics (e.g. from high-interaction traffic) • Find appropriate combination of attack dimensions: • Generation of higher-level “concepts” describing real-world phenomena • Knowledge engineering: • Exploit attack concepts “reasoning system” • Decision tree, expert system, kNN, … ?
Thank you. Note: If you’d like to participate in the WOMBAT project (*), please do not hesitate to contact us: Engin Kirda: engin.kirda@eurecom.fr Marc Dacier: marc_dacier@symantec.com Olivier Thonnard: olivier.thonnard@rma.ac.be Any question? (*) Leita, C.; Pham, V.; Thonnard, O.; Ramirez-Silva, E.;Pouget, F.; Kirda , E.; Dacier, M. The Leurre.com Project: Collecting Internet Threats Information Using a Worldwide Distributed Honeynet. 1st WOMBAT workshop, April 21st-22nd, Amsterdam.
Leurre.com V2.0:SGNET(*) • Novel high-interaction honeypots • SGNET = ScriptGen Hpots + Argos emulator + Nepenthes • Malware analysis: VirusTotal + Anubis Sandbox ScriptGen Anubis “0-day” Automated submissions Malware repository (*) Corrado Leita and Marc Dacier. SGNET: a worldwide deployable framework to support the analysis of malware threat models. (EDCC 2008, Lithuania)