Download
1 / 28
280 likes | 426 Views
A Statistical Analysis of the Precision-Recall Graph. Ralf Herbrich, Hugo Zaragoza , Simon Hill. Microsoft Research, Cambridge University, UK. Overview. 2-class ranking Average-Precision From points to curves Generalisation bound Discussion. “Search” cost-functions.

E N D
A Statistical Analysis of the Precision-Recall Graph Ralf Herbrich, Hugo Zaragoza, Simon Hill. Microsoft Research, Cambridge University, UK. Microsoft Research
Overview • 2-class ranking • Average-Precision • From points to curves • Generalisation bound • Discussion
“Search” cost-functions • Maximise the number of relevant documents found in the top 10. • Maximise the number of relevant documents at the top (e.g. weight inversely proportional to rank) • Minimise the number of documents seen by the user until he is satisfied.
Motivation • Why should 45 August, 2003 work for document categorisation? • Why should any algorithm obtain good generalisation average-precision? • How to devise algorithms to optimise rank dependant loss-functions?
2-class ranking problem X,Y Mapping: X R {y=1} Relevancy: P(y=1|x) P(y=1|f(x))
Collection samples • A collection is a sample: z= ((x1,y1),...,(xm,ym)) (X x {0,1})m • where: • y = 1 if the document x is relevant to a particular topic, • z is drawn from the (unknown) distribution πXY • let k denote the number of positive examples
Ranking the collection • We are given a scoring function f :XR • This function imposes an order in the collection: • (x(1) ,…,x(m)) such that : f(x(1)) > … > f(x(m)) • Hits (i1,…, ik)are the indices of the positive y(j). f(x(i)) y(i) = 1 1 0 1 0 0 1 0 0 0 ij = 1 2 4 7
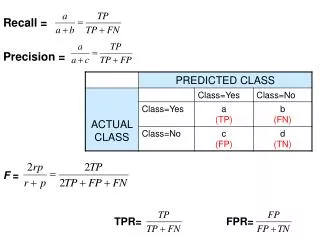
Classification setting • If we threshold the function f, we obtain a classification: • Recall: • Precision: f(x(i)) t
Precision .vs. PGC PGC PGC PRECISION PRECISION
The Precision-Recall Graph After reordering: f(x(i))
1 0.9 0.8 0.7 0.6 0.5 Precision 0.4 0.3 0.2 0.1 0 0 0.2 0.4 0.6 0.8 1 Recall Graph Summarisations Break-Even point
overfitting? Average Precision (TEST SET) Average Precision (TAIN SET)
Overview • 2-class ranking • Average-Precision • From points to curves • Generalisation bound • Discussion
From point to curve bounds • There exist SVM margin-bounds [Joachims 2000] for precision and recall. • They only apply to a single (unknown a priori) point of the curve! Precision Recall
Features of Ranking Learning • We cannot take differences of ranks. • We cannot ignore the order of ranks. • Point-wise loss functions do not capture the ranking performance! • ROC or precision-recall curves do capture the ranking performance. • We need generalisation error bounds for ROC and precision-recall curves
Generalisation and Avg.Prec. • How far can the observed Avg.Prec. A(f,z)be from the expected average A(f) ? • How far can train and test Avg.Prec.?
Approach • McDiarmid’s inequality: For any function g:ZnR with stability c, for all probability measures P with probability at least1-δ over the IID draw of Z
Approach (cont.) • Set n= 2m and call the two m-halves Z1 and Z2. Define gi (Z):=A(f,Zi). Then, by IID :
Bounding A(f,z) - A(f,zi) • How much does A(f,z) change if we can alter one sample (xi,yi)? • We need to fix the number of positive examples in order to answer this question! • e.g. if k=1, the change can be from 0 to 1.
Stability Analysis • Case 1: yi=0 • Case 2: yi=1
Main Result Theorem: For all probability measures, for all f:XR, with probability at least 1- δover the IID draw of a training and test sample both of size m, if both training sample z and test sample z contain at least αm positive examples for all α(0,1), then:
Positive results • First bound which shows that asymptotically training and test set performance (in terms of average precision) converge! • The effective sample size is only the number of positive examples. • The proof can be generalised to arbitrary test sample sizes. • The constants can be improved.
Open questions • How can we let k change, so as to investigate: • What algorithms could be used to directly maximise A(f,z) ?
Conclusions • Many problems require ranking objects in some degree. • Ranking learning requires to consider non-point-wise loss functions. • In order to study the complexity of algorithms we need to have large deviation inequalities for ranking performance measures.