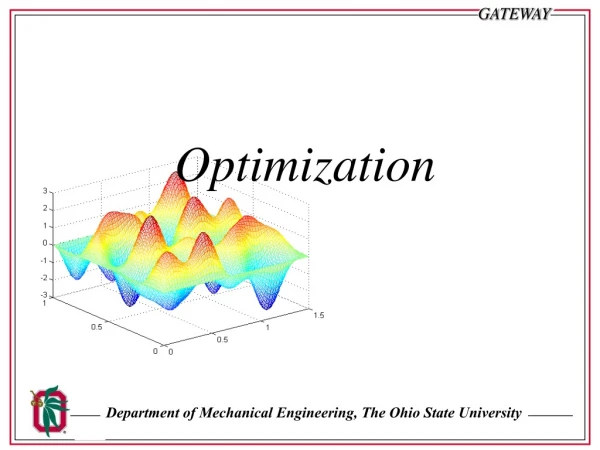
Optimization
Optimization. Water Resources Planning and Management Daene C. McKinney. Reservoirs. Hoover Dam 158 m 35 km3 2,074 MW. Toktogul Dam 140 m 19.5 km3 1,200 MW. Grand Coulee Dam 100 m 11.8 km3 6,809 MW. Dams. Masonry dams Arch dams Gravity dams Embankment dams

Optimization
E N D
Presentation Transcript
Optimization Water Resources Planning and Management Daene C. McKinney
Reservoirs Hoover Dam 158 m 35 km3 2,074 MW Toktogul Dam 140 m 19.5 km3 1,200 MW Grand Coulee Dam 100 m 11.8 km3 6,809 MW
Dams • Masonry dams • Arch dams • Gravity dams • Embankment dams • rock-fill and earth-fill dams • Spillways
St Qt Rt K Qt K St Rt Reservoir
Operating Policy Allocation Policy Example • Allocate reservoir release Rt to 3 users and provide instream flow Qt storage St release Rt inflow It
Optimization • Benefit • Decision variables • Objective: • Constraints: Optimization model
Operating Policy Allocation Policy Simulation
Simulation vs Optimization • Simulation models: Predict response to given design • Optimization models: Identify optimal designs or policies
Problem identification and description Model conceptualization Data Model development Model calibration & parameter estimation Model verification & sensitivity analysis Model Documentation Model application Present results Modeling Process • Problem identification • Important elements to be modeled • Relations and interactions between them • Degree of accuracy • Conceptualization and development • Mathematical description • Type of model • Numerical method - computer code • Grid, boundary & initial conditions • Calibration • Estimate model parameters • Model outputs compared with actual outputs • Parameters adjusted until the values agree • Verification • Independent set of input data used • Results compared with measured outputs
Example – Water Users • Allocate release to users and provide instream flow • Obtain benefits from allocation of xi, i = 1,2,3 • Bi(xi) = benefit to user i from using amount of water xi
Note: if sufficient water is available the allocations are independent and equal to How? Example • Decision variables: • Objective: • Constraint: • Optimization model:
Objective function Decision variables Constraint set Optimization Problems
f(x) minimum x x* Feasible region f(x) X={x: a<x< b} x* x a b X Optimization Problems Find the decision variables, x, that optimize (maximize or minimize) an objective function while satisfying constraints
Feasible region f(x) X={x: a<x< b} x* x a b X Existence of Solutions • Weierstrass Theorem • Describes conditions on the objective function and the constraint set so that we are guaranteed that solutions will always exist • Constraint set is compact (closed and bounded) • Objective function is continuous on the constraint set
x x y y convex nonconvex Convex Sets If x and y are in the set, then z is also in the set, i.e., don’t leave the set to get from x to y
Convex Functions Line segment joining points on a convex function does not lie below the function Linear functions are convex.
Global maximum Concave function f(x) x* x X Existence of Global Solutions • Local-Global Theorem (maximization) • Describes conditions for a local solution to be global • Constraint set is compact and convex • Objective function is continuous on the constraint set and concave • Then a local maximum is global
Solutions – Global or Local? Global Max Local Max
f(x) Global minimum Convex function x* x X Global maximum Concave function f(x) x* x X Solutions • Local - Global Theorem: • If X is convex and f(x) is a convex function, then a local minimum is a global minimum • If X is convex and f(x) is a concave function, then a local maximum is a global maximum
Types of Optimization Problems Nonlinear Program Classic Program Linear Program
f(x) Global minimum Convex function x* x X No ConstraintsSingle Decision Variable • First-order conditions for a local optimum Scalar No constraints Tangent is horizontal • Second-order conditions for a local optimum Curvature is upward
No ConstraintsMultiple Decision Variables • First-order conditions for a local optimum Vector No constraints • n - simultaneous equations
Classical Program Example General Form All equality constraints
Single ConstraintMultiple Decision Variables Vector One constraint
Single ConstraintMultiple Decision Variables Lagrangian First-order conditions N+1 equations
Example Lagrangean First – order conditions Notice the signs
Note: if sufficient water is available the allocations are independent and equal to How? Example • Decision variables: • Objective: • Constraint: • Optimization model:
Example Lagrangean First – order conditions Notice the signs
Example Equal marginal benefits (slopes) for all users
Release Allocation Rule Allocation rule tells you the amount of released water allocated to each use
Classical ProgrammingVector Case – Multiple Constraints Lagrangian Vector M constraints First-order conditions N+M equations N equations M equations
Example From Revelle, C. S., E. E. Whitlach, and J. R. Wright, Civil and Environmental Systems Engineering, Prentice Hall, Upper Saddle River, 1997
Nonlinear Program General Form Example
Reservoir with Power Plant earliest known dam - Jawa, Jordan - 9 m high x1 m wide x 50 m long, 3000 BC Hoover Dam
St Qt Rt K Et K St Ht Et Rt Reservoir with Power Plant Qt
St Et Qt Rt K Reservoir with Power Maximize power production given capacity and inflows • QtInflows (L3/time period) • St Storage volume (L3) • K Capacity (L3) • Rt Release (L3 /period) • Et Energy (kWh) • Ht Head (L) • k Coefficient (efficiency, units) Nonlinear