Download
1 / 38
380 likes | 559 Views
Genome Assembly Final Results. Jeri Dilts Suzanna Kim Hema Nagrajan Deepak Purushotham AMBILY SIVADAS AMIT RUPANI LEO WU. 02 -22- 2012. Outline. Pipeline for evaluation Quantitative evaluation Qualitative Evaluation Choosing the BEST assembly Final results Demo.

E N D
Genome Assembly Final Results Jeri Dilts Suzanna Kim Hema Nagrajan Deepak Purushotham AMBILY SIVADAS AMIT RUPANI LEO WU 02 -22- 2012
Outline Pipeline for evaluation Quantitative evaluation Qualitative Evaluation Choosing the BEST assembly Final results Demo
Strategy – Key alterations • Prinseq Preprocessing Unnecessary, assemblers have built in capabilities • Use Prinseq for data statistics • Error Correction Does not fit methods • Coral is based on Overlap-layout-consensus and works best with de Bruijin Graph assemblers • Echo has never been tested on 454 data • Final Assemblers Newbler, Mira, Celera, AmosCMP • Discarded Assemblers Abyss, Velvet, and Pcap454 • MAIA Hybrid Assembly Needs a close phylogenetic reference genome
Outline Pipeline for evaluation Quantitative Evaluation Qualitative Evaluation Choosing the BEST assembly Final results Demo
Quantitative Evaluation • Metrics • No. of Contigs -> Lesser the better • N50 -> Higher the better • Assembly size -> Closer to the estimated genome, the better • Quantitative Assembly Score N50 * Assembly size No. of Contigs • Higher the score, the better!
Outline Pipeline for evaluation Quantitative evaluation Qualitative Evaluation Choosing the BEST assembly Final results Demo
Qualitative Evaluation • Strategy • Align the assembly contigs to the original reference genome and compute differences • Challenges • No Original reference genome for our data set • Approach • Create simulated 454 read datasets from a completely sequenced genome • Tools used • FlowSim • 454Sim • Art-454
FlowSim • A simulation pipeline based on real data • Lets you model each step of pyrosequencing process • Utilities: • Clonesim : To simulate the shearing step • Usage: clonesim -c count -l dist input.fasta • Gelfilter: To select a certain range of clone lengths. • Usage: gelfilter min max • Kitsim: To attach A and B adaptors. • Usage: kitsim -k key -a adapter input.fasta -o output.fasta • Mutator: To introduce random substitutions and indels in the sequences. • Usage: mutator -iindel_rate -s subst_rateinput.fasta -o output.fasta • Duplicator: Togenerate artificial duplicates of many clones. • Usage: duplicator dup_prob • Flowsim : To simulate the actual pyrosequencing process • Usage: flowsim -G generation input.fasta -o output.sff • Example: clonesim -c 400000 –l “Normal 350 95” input.fasta | gelfilter 25 600| kitsim | mutator | duplicator 0.03 | flowsim –G Titanium -o output.sff
454Sim • 454 Simulation at higher speed and accuracy • USP: Configurable statistical models • Support GS FLX, Titanium and GS 20 • Utilities: • fragsim: To simulate shearing • Usage: fragsim -c 1000000 -l 1000 genome.fasta > genome.fragments.fasta • 454sim: To simulate the sequencing step • Usage: 454sim -o genome.sff genome.fragments.fasta • Example: • fragsim -c 250000 -l 1000 genome.fasta | 454sim –g FLX -o genome.sff
ART-454 • Supports Illumina, 454 and Solexa read simulation • Used for 1000 Genomes Project • Usage: • Art_454 Input.fasta Output prefix Fold_coverage (single – end reads) • Art_454 Input.fasta Output prefix Fold_coverageMean_Flag_LenStd_Deviation (paired end reads)
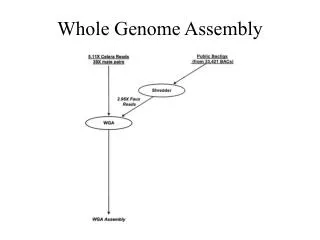
Running pipeline on Simulated reads Reference – Haemophilusinfluenzae F3047 (NC_014922) Ran 454Sim, FlowSim and Art-454 to generate reads Ran de novo assemblers - Newbler, Mira3 and Celera (CABOG) Merged assemblies using Minimus2 Evaluate Assembly Accuracy (How?)
Assembly Accuracy • Challenges • Alignment of contigs to the reference genome • Approach • Local alignment (BLAST, bwa, bowtie) • Whole genome alignment (Mauve, MUMmer) • Align the assembly to the reference genome • Compute nucleotide differences, gaps and rearranged segments
Mauve • Uses positional homology genome alignment • Each site in the assembly maps to at most one site on the reference • Optimized contiguity • E.g. progressiveMauve • Ordering of contigs: Mauve Contig Mover algorithm • Compare to identify differences
Mauve Assembly Metrics • Basecalling accuracy • Count and location of bases called wrongly • Direction of miscalling, e.g. A->G • Count and location of bases predicted to exist, but uncalled • Genome content accuracy • Count and location of bases missing from the assembly • Count and location of extra bases in the assembly • Size distribution of the missing and extra fragments • Genome structure accuracy • Estimate of misassembly count
Example • Reference genome • AGGCTAGCGCGCGATTAGGATC • Assembly • AGTAGCGGGCCGATTAAGANC • Alignment • AGGCTAGCGCG - CGATTAGGATC • AG - - TAGCGGGCCGATTAAGANC • Miscalls • 2 (C->G and G->A) • Uncalled bases • 1 (N) • Extra bases • 1 (Insertion of C ) • Missing bases • 2 (Deletion of GC ) • Missing segments • 1 • Extra segments • 1
Scoring simulated reads with Mauve Reference – HaemophilusinfluenzaeF3047 (NC_014922) Ran 454Sim, FlowSim and Art-454 to generate reads Ran de novo assemblers - Newbler, Mira3 and Celera (CABOG) Merged assemblies using Minimus2 Ran Mauve to align the assemblies back to the reference genome Computed Assembly metrics
Outline Pipeline for evaluation Quantitative evaluation Qualitative Evaluation Choosing the BEST assembly Final results Demo
Choosing the BEST assembly • Quantitative metrics • N50 • Contig count • Assembly size • Qualitative metrics • Miscalled bases • Uncalled • Missing bases • Extra bases
Assembly Scores Quantitative Score N50 * Assembly size No. of Contigs Qualitative Score ( % Accuracy ) Miscalls + Uncalled + Missing + Extra + Gaps in Ref + Gaps in Assembly 1 - Reference Size
Metrics Summary – Art 454 ASSEMBLY SCORE QUALITY SCORE
Inference • Striking a balance is critical • We chose • Newbler + MIRA for H. haemolyticus • Newbler + AMOScmp for H. influenzae Universally applicable pipeline Assembling specific genomes/strains • Choose the one that works the best balance for your genome • NEWBLER + (CELERA/MIRA) • Adopt the most consistent tool /pipeline (Conservative approach) • NEWBLER
Outline Pipeline for evaluation Quantitative evaluation Qualitative Evaluation Choosing the BEST assembly Final results Demo
Key take-aways • Understand your data • Platform, long/short reads, Coverage, Paired/Non-paired, Quality of basecalling etc • Evaluate the need for error correction • Choose a set of “best” assemblers • De novo /Reference assembly, DBG/OLC algorithm • Merge assemblies • Ordering and Scaffolding • Finishing Evaluate your assembly at every step to ensure that you are on the right track!
Coming next >>> Demo