
Uploaded by
myra-snyder
1 SLIDES
142 VIEWS
10LIKES
Paleoproductivity
DESCRIPTION
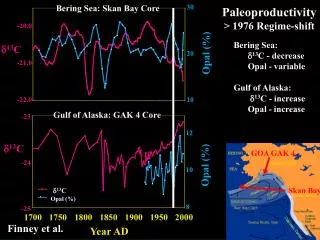
Paleoproductivity. 30. -20.0. 20. -21.0. -22.0. 10. -23. 12. -24. 10. -25. 8. 1700. 1750. 1800. 1850. 1900. 1950. 2000. Bering Sea: Skan Bay Core. Paleoproductivity > 1976 Regime-shift Bering Sea: d 13 C - decrease Opal - variable Gulf of Alaska:
Download
1 / 1
Download Presentation 
Paleoproductivity
An Image/Link below is provided (as is) to download presentation
Download Policy: Content on the Website is provided to you AS IS for your information and personal use and may not be sold / licensed / shared on other websites without getting consent from its author.
Content is provided to you AS IS for your information and personal use only.
Download presentation by click this link.
While downloading, if for some reason you are not able to download a presentation, the publisher may have deleted the file from their server.
During download, if you can't get a presentation, the file might be deleted by the publisher.
E N D
Presentation Transcript
Paleoproductivity 30 -20.0 20 -21.0 -22.0 10 -23 12 -24 10 -25 8 1700 1750 1800 1850 1900 1950 2000 Bering Sea: Skan Bay Core Paleoproductivity > 1976 Regime-shift Bering Sea: d13C - decrease Opal - variable Gulf of Alaska: d13C - increase Opal - increase d13C Opal (%) Gulf of Alaska: GAK 4 Core d13C GOA GAK 4 Opal (%) Skan Bay d13C Opal (%) Finney et al. Year AD
More Related