Download
1 / 14
140 likes | 157 Views
Learn how United Water is addressing market challenges by implementing Lean concepts for data management. Discover the benefits of "Lean Water" operations and how a networked data management solution improved efficiency, accuracy, and compliance.

E N D
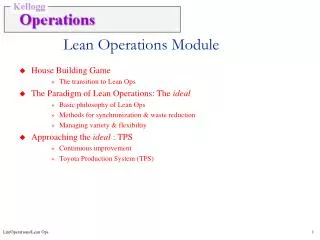
Lean Operations for Water and Wasterwater Controlling Cost While Improving Efficiency…A Real World View
Utility Market’s Growing Challenges • Budgets are tight • Treatment costs are increasing • Infrastructure investments going unfunded • Raising rates is difficult • New regulations are coming at a fast pace • Retiring workforce = knowledge loss Everyone is being asked to do more with less but how?
United Water (UW): A Real World View • Providing Water and Wastewater services for more than140 years • Servicing ~400 municipalities and 7 million people across the US • Facility sizes vary from very small to some of the largest in the world United Water’s Mission: providing comprehensive, sustainable solutions that promote public, economic and environmental health
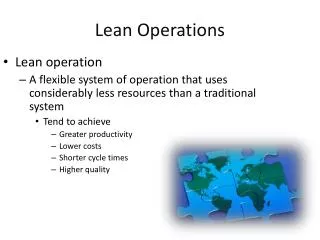
Addressing IndustryChallengeswith “Lean” Concepts Steps to Enable Lean • Create lean culture • Take holistic approach • Automate manual processes • Achieve Lean sustainability “Lean applies in every business and every process. It is not a tactic or a cost reduction, but a way of thinking and acting for an entire organization.” - Lean Institute
UW’s Data Management Situation • Waste: Operators entered data into spreadsheets • Waste: Operations spent hours inputting data for reporting • Waste: Managers / auditors couldn’t access data • Compliance and performance reports not readily available • Visibility into overall operations difficult • Minimal consistency and transparency across ~ 400 water and wastewater municipalities • Data gathered but not converted to actionable information • Questionable data accuracy – operations group not data owners • Data difficult to access • Poor tools for easy data visualization and analysis • Time consuming to enter Ineffective, Inefficient Data Management System
Accurate Data Critical to UW’s Success • Risks for inaccuracy • Environmental or public health impact • Reputation – critical for all current and future contracts • Fines / regulator scrutiny • Citizen complaints • Inefficient operations = higher costs • Compliance is critical to business success • Trust of communities and municipalities • Strong, productive relations with regulators • Maintaining compliance with ISO standards Top Down Directive to Improve Data Management
Project Objectives • 1. Increase Efficiency • Automatic data inputs • One central location for data storage • Provide data consistency across entire organization • Manage unique data requirements • 2. Increase Confidence in Data • Ensure data accuracy • Provide accurate compliance reporting • Anticipate compliance issues before they occur • 3. Reduce Costs Enable “Lean Water” Operations
New Solution Enabled “Lean Operations” Implemented Networked Data Management Solution • Holistic Approach: Networked, centralized database • Track all environmental, safety, compliance needs from single source via web • Automate Manual Processes: e-interfaces and electronic entry forms • Pulled data from existing SCADA and LIMS systems • Allowed for consistent data entry and no replication or errors • Ensure Data Accuracy: Auto incoming data checks and audit trails • Turn Data into Information: Graphing, statistics, auto alerting & reporting • Helps with compliance, accuracy, sampling activity tracking and results • Achieve Sustainability: Dashboards highlighting key information • Tailored for individual areas of operations for KPI monitoring and ease of use
Results – Objective 1: Increase Efficiency • Achieved data consistency with common database • Automatic data collection • Disparate systems linked together • Employees all see same critical data; leverage expertise across sites • Provided easy access to accurate, organized data • Meaningful comparisons of processes and parameters • Accurate data for engineering firms now provided in minutes • Quickly provide comprehensive information to regulatory agencies • Provided tools to monitor sustainable improvements • Dashboards provide easy access to key information • More efficient and effective internal communications • Better data for planning and monitoring Key Performance Indicators (KPIs) Freed Up Time for More Value-Added Work
Results – Objective 1: Increase Efficiency Dashboards provide transparency and focus Division Compliance Report Reference Documents Dashboard Changed Focus from Data Collection to Data Analysis
Results – Objective 2: Confidence in Data • Improved incoming data accuracy • More automated data entry and less transposition yielded fewer errors • Incoming data checks provided built in quality control • Improved report timeliness and accuracy • Reports and sampling now on time AND accurate • Business reports sent automatically on a set schedule and on triggers • Automatic data rollup and drill down functionality • One source of truth • Configured to unique facility data needs but still part of one unified database • One system to go to for wide range of data (ex. operations, natural gas, chemicals and electricity consumption) Enabled Data-Driven “Lean” Culture
Results – Objective 2: Confidence in Data NPDES report easily generated with data transposition Enterprise-wide data is organized and accessible Data turned to meaningful information Enabled Easy Visual Management
Results – Objective 3: Reduce Costs • Savings in excess of 6 figures • Took advantage of time freed from data collection • Focusing more attention on safety and environmental work • Focusing more on data-driven operations improvement projects • Availability of data helping expose cost savings opportunities & track progress • Improved process for cost analysis and budgeting • Fast, reliable, and easy aggregation of operations expenses • Easier and more accurate budgeting and forecasting “The progress made at both the managerial and operational level is significant and continues to advance” Driving Sustained Cost Reduction
Addressing IndustryChallengeswith “Lean” Concepts Steps to Enable Lean • Create lean culture • Take holistic approach • Automate manual processes • Achieve Lean sustainability “Lean applies in every business and every process. It is not a tactic or a cost reduction, but a way of thinking and acting for an entire organization.” - Lean Institute