Function III
100 likes | 371 Views
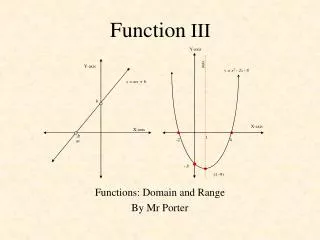
Y-axis. y = x 2 - 2x - 8. axis. Y-axis. y = mx + b. b. X-axis. X-axis. -b m. 1. -2. 4. - 8. (1,-9). Function III. Functions: Domain and Range By Mr Porter. Definitions. Function:.

Function III
E N D
Presentation Transcript
Y-axis y = x2 - 2x - 8 axis Y-axis y = mx + b b X-axis X-axis -b m 1 -2 4 - 8 (1,-9) Function III Functions: Domain and Range By Mr Porter
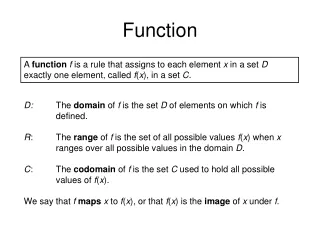
Definitions Function: A function is a set of ordered pair in which no two ordered pairs have the same x-coordinate. Domain The domain of a function is the set of all x-coordinates of the ordered pairs. [the values of x for which a vertical line will cut the curve.] Range The range of a function is the set of all y-coordinates of the ordered pairs. [the values of y for which a horizontal line will cut the curve] Note: Students need to be able to define the domain and range from the equation of a curve or function. It is encourage that student make sketches of each function, labeling each key feature.
Y-axis y = 3x + 6 4 X-axis 6 Y-axis 6 X-axis Every vertical line will cut 2x+3y =12. Every vertical line will cut y = 3x + 6. -2 Every horizontal line will cut 2x+3y =12 Every horizontal line will cut y = 3x + 6 Linear Functions • Any equation that can be written in the • General form ax + by + c = 0 • Standard form y = mx + b Sketching Linear Functions. Find the x-intercep at y = 0 And the y-intercept at x = 0. Examples a) y = 3x + 6 b) 2x + 3y = 12 x-intercept at y = 0 2x = 12 x = 6 y-intercept at x = 0 3y = 12 y = 4 x-intercept at y = 0 0 = 3x + 6 x = -2 y-intercept at x = 0 y = 6
Y-axis Y-axis (a,b) (4,5) X-axis X-axis Y-axis x = 4 x = a x = -2 X-axis (-2,-6) Special Lines Examples Vertical Lines: x = a - these are not functions, as the first element in any ordered pair is (a, y) a) x = 4 Equation of a vertical line is: i) x = a ii) x - a = 0 Domain: x = 4 Range: all y in R Sketch b) x + 2 = 0 Domain: x = a Range: all y in R Domain: x = -2 Range: all y in R
Y-axis (-5,3) y = 3 X-axis Y-axis (a,b) y = a X-axis Y-axis X-axis y = -6 (2,-6) Special Lines Examples Horizontal Lines: y = a - these are functions, as the first element in any ordered pair is (x, a) a) y = 3 Equation of a horizontal line is: i) y = a ii) y - a = 0 Domain: all x in R Range: y = 3 Sketch b) y + 6 = 0 Domain: all x in R Range: y = b Domain: all x in R Range: y = -6
The five steps in sketching a parabola function: 1) If a is positive, the parabola is concave up. If a is negative, the parabola is concave down. 2) To find the y-intercept, put x = 0. 3) To find the x-intercept, form a quadratic and solve ax2 + bx + c = 0 * factorise * quadratic formula 4) Find the axis of symmetry by 5) Use the axis of symmetry x-value to find the y-value of the vertex, h 4) Axis of symmetry at = -1 Y-axis X-axis -3 -1 1 -3 (-1,-4) Parabola: y = ax2 +bx + c Example Sketch y = x2 + 2x - 3, hence, state its domain and range. 1) For y = ax2 + bx + c a = 1, b = +2, c = -3 . Concave-up a = 1 2) y-intercept at x = 0, y = -3 3) x-intercept at y = 0, (factorise ) (x - 1)(x + 3) = 0 x = +1 and x = - 3. 5) y-value of vertex: y = (-1)2 +2(-1) - 3 y = -4 Domain: all x in R Range: y ≥ -4 Domain: all x in R Range: y ≥ h for a > 0 Range: y ≤ h for a < 0
The five steps in sketching a parabola function: 1) If a is positive, the parabola is concave up. If a is negative, the parabola is concave down. 2) To find the y-intercept, put x = 0. 3) To find the x-intercept, form a quadratic and solve ax2 + bx + c = 0 * factorise * quadratic formula 4) Find the axis of symmetry by 5) Use the axis of symmetry x-value to find the y-value of the vertex, h 4) Axis of symmetry at = +2 Y-axis X-axis 2 (2,-1) -5 Parabola: y = ax2 +bx + c Example Sketch y = –x2 + 4x - 5, hence, state its domain and range. 1) For y = ax2 + bx + c, a = -1, b = +4, c = -5. Concave-down a = -1 2) y-intercept at x = 0, y = -5 3) x-intercept at y = 0, NO zeros by Quadratic formula. 5) y-value of vertex: y = -(2)2 +4(2) - 5 y = -1 Domain: all x in R Range: y ≤ -1 Domain: all x in R Range: y ≥ h for a > 0 Range: y ≤ h for a < 0
Y-axis axis y = x2 - 2x - 8 The five steps in sketching a parabola function: 1) If a is positive, the parabola is concave up. If a is negative, the parabola is concave down. 2) To find the y-intercept, put x = 0. 3) To find the x-intercept, form a quadratic and solve ax2 + bx + c = 0 * factorise * quadratic formula Find the axis of symmetry by 5) Use the axis of symmetry x-value to find the y-value of the vertex, h X-axis 1 -2 4 - 8 (1,-9) Worked Example 1: Your task is to plot the key features of the given parabola, sketch the parabola, then state clearly its domain and range. Sketch the parabola y = x2 - 2x - 8, hence state clearly its domain and range. Step 1: Determine concavity: Up or Down? For the parabola of the form y = ax2 + bx + c a = 1 => concave up Step 2: Determine y-intercept. Let x = 0, y = -8 Step 3: Determine x-intercept. Solve: x2 - 2x - 8 = 0 Factorise : (x - 4)(x + 2) = 0 ==> x = 4 or x = -2. Step 4: Determine axis of symmetry. Step 5: Determine maximum or minimum y-value (vertex). Substitute the value x = 1 into y = x2 - 2x - 8. Domain all x in R Range y ≥ -9 y = (1)2 - 2(1) - 8 = -9 Vertex at (1, -9)
Y-axis The five steps in sketching a parabola function: 1) If a is positive, the parabola is concave up. If a is negative, the parabola is concave down. 2) To find the y-intercept, put x = 0. 3) To find the x-intercept, form a quadratic and solve ax2 + bx + c = 0 * factorise * quadratic formula Find the axis of symmetry by 5) Use the axis of symmetry x-value to find the y-value of the vertex, h axis (1,16) 15 X-axis -5 -1 3 f(x)=15 - 2x - x2 Worked Example 2: Your task is to plot the key features of the given parabola, sketch the parabola, then state clearly its domain and range. Sketch the parabola f(x) = 15 - 2x - x2, hence state clearly its domain and range. Step 1: Determine concavity: Up or Down? For the parabola of the form f(x) = ax2 + bx + c a = -1 => concave down Step 2: Determine y-intercept. Let x = 0, f(x) = +15 Step 3: Determine x-intercept. Solve: 15 - 2x - x2 = 0 Factorise : (3 - x)(x + 5) = 0 ==> x = 3 or x = -5. Step 4: Determine axis of symmetry. Step 5: Determine maximum or minimum y-value (vertex). Substitute the value x = -1 into y = 15 - 2x - x2. Domain: all x in R Range: y ≤ 16 y = 15 - 2(-1) - (-1)2 = 16 Vertex at (1, 16)
Y-axis h(x) = 2x2 + 7x - 15 Y-axis 5 X-axis X-axis 11/2 -5 -13/4 21/2 -15 f(x) = 5 - 2x (-13/4 ,-211/8 ) h(x) = x2 + 2x + 5 Y-axis Y-axis 4 X-axis NO x-intercepts. (try quadratic formula?) 5 -4/5 (-1,4) -1 X-axis g(x) = 5x + 4 Exercise: For each of the following functions: a) sketch the curve b) sate the largest possible domain and range of the function. (i) f(x) = 5 - 2x (ii) h(x) = 2x2 + 7x - 15 Domain: All x in R Range: All y in R Domain: All x in R Range: All y ≥ -211/8 (iii) h(x) = x2 + 2x + 5 (iv) g(x) = 5x + 4 Domain: All x in R Range: All y ≥ 4 Domain: All x in R Range: All y in R