Download
1 / 8
90 likes | 279 Views
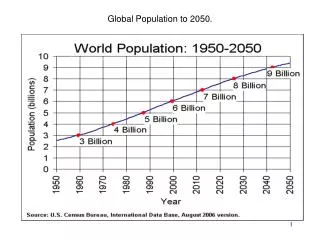
Population Trends by Age and Race, United States, 1950 to 2013, and Projected 2014 to 2050. Prepared by the Community Service Council, with support from the Metropolitan Human Services Commission July 17, 2014.

E N D
Population Trends by Age and Race, United States, 1950 to 2013, and Projected 2014 to 2050 Prepared by the Community Service Council, with support from the Metropolitan Human Services Commission July 17, 2014
Persons in Selected Age Groups as Percentage of Total US Population, and Children as Percentage of Dependent Population, 1950-2013 and Projected 2014-2050 0-17: % of dependent pop 18-64: % of total pop 0-17: % of total pop 65+: % of total pop Source: Federal Interagency Forum on Child and Family Statistics, America’s Children in Brief: Key National Indicators of Well-Being, 2014.
Persons in Selected Age Groups as Percentage of Total US Population, By Decade: 1950-2010 and Projected 2020-2050 Source: Federal Interagency Forum on Child and Family Statistics, America’s Children in Brief: Key National Indicators of Well-Being, 2014.
Persons in Selected Age Groups as Percentage of Total US Population: 1950-2010 and Projected 2020-2050 Source: Federal Interagency Forum on Child and Family Statistics, America’s Children in Brief: Key National Indicators of Well-Being, 2014.
Number of Children (in millions) Ages 0-17 in United States by Age, By Decade: 1950-2010 and Projected 2020-2050 Source: Federal Interagency Forum on Child and Family Statistics, America’s Children in Brief: Key National Indicators of Well-Being, 2014.
Number of Children (in millions) Ages 0-17 in United States by Age: 1950-2010 and Projected 2020-2050 Source: Federal Interagency Forum on Child and Family Statistics, America’s Children in Brief: Key National Indicators of Well-Being, 2014.
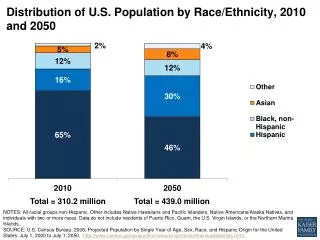
Percent Distribution of Children Ages 0-17 in United States by Race/Hispanic Origin: 1980-2010 and Projected 2020-2050 8.9% 7.4% 1.7% 0.8% 35.6% 14.5% 6.6% 0.8% 74.0% 13.2% 36.4% Note: “Two or more races” category was introduced in 2000. Source: Federal Interagency Forum on Child and Family Statistics, America’s Children in Brief: Key National Indicators of Well-Being, 2014.
Percent Distribution of Children Ages 0-17 in United States by Race/Hispanic Origin: 1980-2010 and Projected 2020-2050 Note: “Two or more races” category was introduced in 2000. Source: Federal Interagency Forum on Child and Family Statistics, America’s Children in Brief: Key National Indicators of Well-Being, 2014.