Download
1 / 36
360 likes | 488 Views
Potential Levers for Zimbabwe Economic Recovery. Critical Evaluation of RADS. Focuses on the comparative advantages of Africa and Zimbabwe. Looks at what resources can be leveraged to jump start and grow economy. What it does not deal with is the triple factors of;

E N D
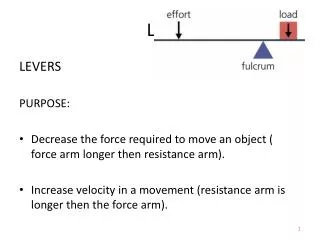
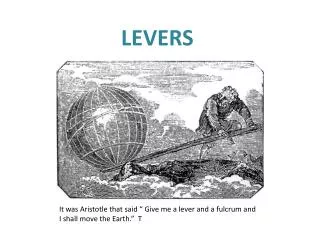
Critical Evaluation of RADS • Focuses on the comparative advantages of Africa and Zimbabwe. • Looks at what resources can be leveraged to jump start and grow economy. • What it does not deal with is the triple factors of; • Market Driven Growth (Competitive Advantage) • Structural Capacity (Value Chain Development) • Institutional Capacity (Targeted capacitating of change facilitating institutions)
A sustainable agricultural system requires strength across the value chain as well as a strong enabling environment. Increased food security* and incomes Goal • Improved yields • Decreased risk • Greater efficiency • Sustainability • Greater demand • Better prices Intermediate outcomes Access to high quality inputs Access to knowledge & technology Access to markets Agricultural value chain Financing Enabling Environment Infrastructure Institutions; Policy Environment Source: R Sithole 2008
Twin Focus Areas • Food Security Imperative • There is a need for a sustainable plan to bring local production , processing and distribution of food security crops to meet local demand. • Industrial Development Imperative • There is a need to identify products that can be produced for both local, and more importantly external markets in a way that makes use of all available economic assets.
What is Food Security? “Food security exists when all people, at all times, have physical and economic access to sufficient, safe and nutritious food that meets their dietary needs and food preferences for an active and healthy life”. (World Food Summit, 1996) Four factors are at play when determining food security: 5
Ranking of productivity drivers in Asia, a possible template for ZIMBABWE? Source:”Investment, Subsidies, and Pro-Poor Growth in Rural India”, IFPRI, 2007; “Policies and public investments to promote smallholder green revolutions in Africa: lessons from Asia”, GISAMA, 2009; “Unappreciated Facts about Staple Food Markets”, FSRP, 2010
Landscape of the banking sub-sector in Zimbabwe • Principal providers of credit to the agricultural sector 80% of the market share in terms of the value of loan portfolio is in the hands of eight institutions. The sizes of the loan portfolios range from US$50,000 to US$5 million 4 of the 13 private commercial banks are multinational institutions. These banks face the prospect of losing their majority foreign ownership as a result of the new indigenization and economic empowerment Act that requires them to indigenize 51% of their shareholding. There is no interbank lending facility • Statistical reports in the banking sector indicate that as at end of April 2010, there was about US$1,708 billion circulating in the economy compared to an estimate of US$10 billion required to rehabilitate the economy Source: “Zimbabwe Agricultural Sector Market Study”, USAID, June 2010
ZIM GDP Growth 1990 to 2008 Source: Prof Tony Hawkins 2008
Agricultural Output (1990 prices) Source: Prof Tony Hawkins 2008
Manufacturing Value-Added Source: Prof Tony Hawkins 2008
Formal employment Source: Prof Tony Hawkins 2008
Mining Output (1990 prices) Source: Prof Tony Hawkins 2008
Real wages Source: Prof Tony Hawkins 2008
It’s important to understand the common themes of what has happened.
STRUCTURAL CHANGE IN ECONOMIC LANDSCAPE • Demographics • Sectoral structure of output • De-industrialization • The balance between the formal and informal economies • Consumption patterns • Market segments • Collapse of savings and investment • The sectoral structure of exports and imports • The nature of production functions, and • The impact of globalization Source: Prof Tony Hawkins 2008
WHAT SHAPE DOES THE ‘NEW’ ECONOMY HAVE? Source: Prof Tony Hawkins 2008
WHAT SHAPE DOES THE ‘NEW’ ECONOMY HAVE? Source: Prof Tony Hawkins 2008
Analysing Old vs. New economy Past vs. Current Potential Understand barriers to regaining position Seek niche opportunities to make use of skills and infrastructure High Past potential of sector Explore potential for increased intervention Low Not interesting Low High Future potential of sector Source: Technoserve Zimbabwe 2010
Sectoral Positioning Cotton, tobacco Manufacturing Horticulture Textiles High Commodities Coffee/tea Past potential Mining Technology Low Livestock Telecoms Alternative energy High Low Future potential Source: Technoserve Zimbabwe 2010
Comparing Past & Future Technology and Markets Positioning New marketing strategy required; can grow despite lack of access to capital Complete rethink: akin to building a new industry Different Market Position Industry will scale up by itself once policy barriers are removed Significant recapitalization in line with understood market needs Same Same Different Technology/production methods Source: Technoserve Zimbabwe 2010
Positioning of Sectors Re: Technology & Markets Manufacturing? Different ? Market Coffee Dairy Cattle Poultry? Same Different Same Technology/production methods Source: Technoserve Zimbabwe 2010
Potential within specific Agric Sectors : Smallholder Vs Large-scale Commercial Cotton 100% smallholder Maize Tobacco Past Sugar Poultry 100% commercial Soy Coffee Cattle Dairy 100% commercial 100% smallholder Future Source: Technoserve Zimbabwe 2010
Growth constraints maize: Maize productivity in SADC countries is low Source: FAOstat; “Addressing Declining Productivity and the Threat of Climate Change with Conservation Agriculture “, NFU, 2009
The production has been declining over the years The reasons for the downward trend, before the fast track land reform, include a gradual switch by the large-scale commercial farms from maize, which became a GMB-controlled crop, to other non-controlled crops such as tobacco, cotton, among others A more recent decline (since 2002) is due to the structural change precipitated by land tenure policies, the lack of investments/funds domestically and externally in agriculture sector, and overriding economic deterioration Production dropped since 2008, mainly because of droughts Source: “FAO/WFP Crop and Food Security Assessment Mission to Zimbabwe”, FAO/WFP, 2009; GraZim3; “Zimbabwe Agricultural Sector Market Study”, USAID, June 2010; “Price Monitoring and Analysis Country Brief”, FAO/EU, May 2010; Robertson Economic Information Services, 2007; “Agriculture: Future Scenarios for Southern Africa”, IISD, 2009; Personal Communication Zimbabwe Commercial Farmers Union * CFU estimates maize production in 2009/10 to be approximately 575.000 MT, while the FAO has endorsed the Government’s estimate of 1.3 million MT
This decline was caused by a decrease in productivity, and not in area planted Source: “FAO/WFP Crop and Food Security Assessment Mission to Zimbabwe”, FAO/WFP, 2009
The national productivity hides differences across regions Source: “FAO/WFP Crop and Food Security Assessment Mission to Zimbabwe”, FAO/WFP, 2009
Zimbabwe is just the 7th biggest producer of maize in the region Source: GIEWS Country Briefs; FAOstat * Data from 2009 ** Forecast for 2010 30
Growth constraints soy: Soy productivity in SADC countries is low Source: FAOstat; “Addressing Declining Productivity and the Threat of Climate Change with Conservation Agriculture “, NFU, 2009; Personal communication Professor Makonese, Soy Research Team at the University of Zimbabwe, 2010
The production has been declining in the last decade Soya production was lower in 2009/10 compared to the previous year because of a reduction in area under the crop following low market prices About 50,000 MT of soya is estimated to have been imported in 2009. Imports of good quality and competitively priced soya are from Malawi and Zambia where due to the SADC protocol, agricultural commodities come in duty free • Smallholder farmers account for less than 10% of soya production. Best area to grow soy is Mashonaland Source: “Zimbabwe Agricultural Sector Market Study”, USAID, June 2010; Robertson Economic Information Services, 2007; TechnoServe Soy Concept for Zimbabwe, 2010; Personal Communication Zimbabwe Commercial Farmers Union, 2010; Personal communication Elizabeth Musimwa, National Soy Producers Association, 2010 * Some sources indicate 89.000 tons, and others 150.000
Still, in the region Zimbabwe is the third biggest producer of soy Source: GIEWS Country Briefs; FAOstat * Data from 2009 ** Forecast for 2010 33
Livestock represents 34% of the agricultural GDP, and cattle and poultry are the biggest contributors Approximately 55% of households in communal farming areas own cattle, more than 70% own goats and over 80% have chickens Livestock (34%) Others (66%) Source: CIA Factbook, 2009; “Cattle Production Manual”, Cock, 2006; “Zimbabwe Agricultural Sector Market Study”, USAID, June 2010; “Future Directions for Livestock Production in the Smallholder Farming Sector in Zimbabwe”, FAO, 2010
This decreased the importance of Zimbabwe in the region as a meat producer In 1995, Zimbabwe was the fourth chicken meat producer in the region (18.975 tons) In 1995, Zimbabwe was the second largest beef producer in the region (73.169 tons) In 1995, Zimbabwe was the sixth largest pork producer in the region (13.101 tons) Source: FAOstat; “What would it take for the Cattle Industry to achieve its Potential?”, World Bank, 2010; “Report on the SADC poultry forum “, PAZ, June 2009; DAHDL, 2008 * Data from DAHDL ** Data from 2007 35
Domestic demand for chicken meat has increased significantly with the economic crisis, as consumer preferences shifted towards low cost meat Source: “Zimbabwe Agricultural Sector Market Study”, USAID, June 2010 * Pork, sheep, goat 36