Download
1 / 67
670 likes | 791 Views
Near-Perfect Adaptation in Bacterial Chemotaxis. Yang Yang and Sima Setayeshgar Department of Physics Indiana University, Bloomington, IN. E. coli and Bacteria Chemotaxis. http://www.rowland.harvard.edu/labs/bacteria/index_movies.html. Increasing attractants or Decreasing repellents.

E N D
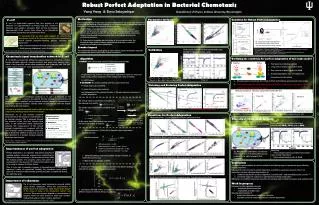
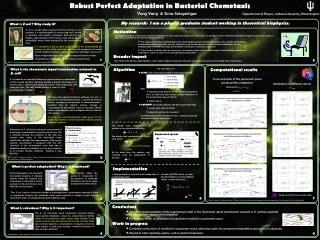
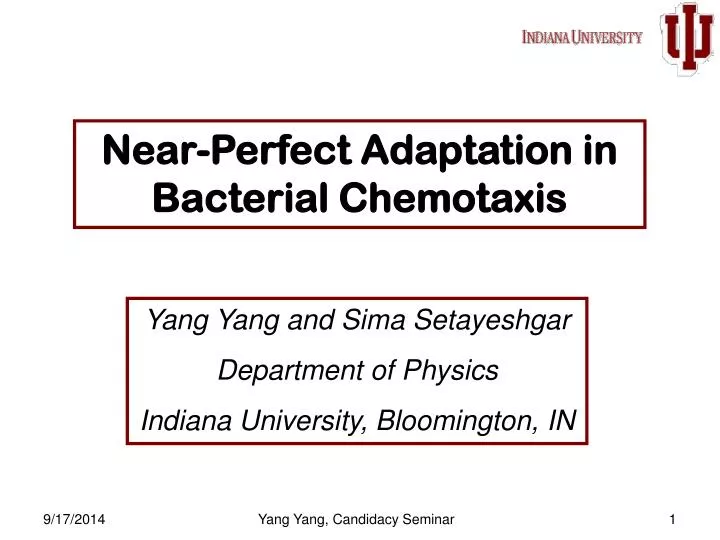
Near-Perfect Adaptation in Bacterial Chemotaxis Yang Yang and Sima Setayeshgar Department of Physics Indiana University, Bloomington, IN Yang Yang, Candidacy Seminar
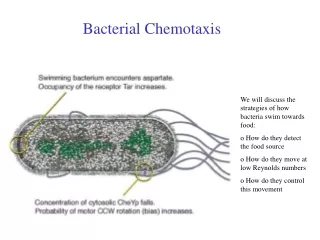
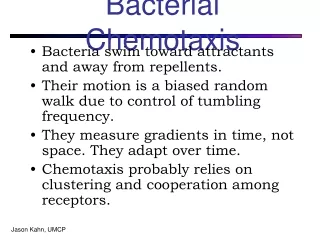
E. coli and Bacteria Chemotaxis http://www.rowland.harvard.edu/labs/bacteria/index_movies.html Increasing attractants or Decreasingrepellents Yang Yang, Candidacy Seminar
Chemotaxis Signal Transduction Network in E. coli Stimulus Signal Transduction Pathway [CheY-P] Motor Response Flagellar Bundling Histidine kinase Methylesterase Couples CheA to MCPs Response regulator Methyltransferase Dephosphorylates CheY-P Motion CheW CheR CheB CheZ CheA CheY Run Tumble Yang Yang, Candidacy Seminar
Robust Perfect Adaptation From Sourjik et al., PNAS (2002). Steady state [CheY-P] / running bias independent of value constant external stimulus (adaptation) Precision of adaptation insensitive to changes in network parameters (robustness) Adaptation Precison FRET signal [CheY-P] CheR fold expression Fast response Slow adaptation From Alon et al.,Nature (1999). Yang Yang, Candidacy Seminar
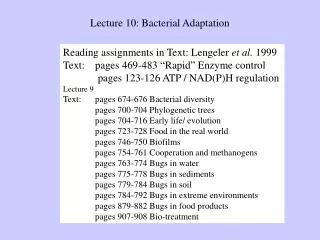
This Work: Outline • New computational scheme for determining conditions and numerical rangesfor parameters allowing robust (near-)perfect adaptation in the E. coli chemotaxis network • Comparison of results with previous works • Extension to other modified chemotaxis networks, with additional protein components • Conclusions and future work Yang Yang, Candidacy Seminar
E. coli ChemotaxisSignaling Network • Ligand binding • Methylation • Phosphorylation phosphorylation methylation Ligand binding Yang Yang, Candidacy Seminar
Michaelis-Menten Kinetics Enzymatic reaction: Where E is the enzyme, S is the substrate, P is the product. A key assumption in this derivation is the quasi steady state approximation, namely that the concentration of the substrate-bound enzyme changes much more slowly than those of the product and substrate. Therefore, it may be assumed that it is in steady state: where Km is the Michaelis Menten Constant (MM constant) Yang Yang, Candidacy Seminar
Reaction Rates Yang Yang, Candidacy Seminar
START with a fine-tuned model of chemotaxis network that: • reproduces key features of experiments • is NOT robust • AUGMENT the model explicitly with the requirements that: • steady state value of CheY-P • values of reaction rate constants, • are independent of the external stimulus, s, thereby explicitly incorporating perfect adaptation. : state variables : reaction kinetics : reaction rates : external stimulus Approach … Yang Yang, Candidacy Seminar
Augmented System The steady state concentration of proteins in the network satisfy: The steady state concentration of = [CheY-P] must be independent of stimulus, s: where parameter allows for “near-perfect” adaptation. Reaction rates are constant and must also be independent of stimulus, s: Discretize s in range {slow, shigh} Yang Yang, Candidacy Seminar
Physical Interpretation of Parameter, : Near-Perfect Adaptation • Measurement of c = [CheY-P] by flagellar motor constrained by diffusive noise • Relative accuracy*, • Signaling pathway required to adapt “nearly” perfectly, to within this lower bound • (*) Berg & Purcell, Biophys. J. (1977). : diffusion constant (~ 3 µM) : linear dimension of motor C-ring (~ 45 nm) : CheY-P concentration (at steady state ~ 3 µM) : measurement time (run duration ~ 1 second) Yang Yang, Candidacy Seminar
Implementation • Use Newton-Raphson (root finding algorithm with back-tracking), to solve for the steady state of augmented system, • Use Dsode (stiff ODE solver), to verify time- dependent behavior for different ranges of external stimulus by solving: Yang Yang, Candidacy Seminar
Converting from Guess to Solution Starting from initial guess A, the solution to B is generated. A • 3%<<5% • 1%<<3% • 0%<<1% Inverse of T3 MM constant (K3R-1) B T3 autophosphorylation rate (k3a) Yang Yang, Candidacy Seminar
Parameter Surfaces Surface 2D projections Inverse of T1 methylation MM constant (K1R-1) Inverse of T1demethylation MM constant(k1B-1) Inverse of T1 methylation MM constant (K1R-1) • 1%<<3% • 0%<<1% T1autophosphorylation rate K1a Yang Yang, Candidacy Seminar
Validation Verify steady state NR solutions dynamically using DSODE for different stimulus ramps: Concentration (µM) Time (s) Yang Yang, Candidacy Seminar
Violating and Restoring Perfect Adaptation (5e+6,10) CheYp Concentration (µM) Inverse of T3 MM constant (K3R-1) (1e+6,10) T3 autophosphorylation rate (k9) Time (s) Step stimulus from 0 to 1e-3M at t=500s Yang Yang, Candidacy Seminar
Conditions for Perfect Adaptation: Kinetic Parameters Yang Yang, Candidacy Seminar
Inverse of Methylation MM Constant Autophosphorylation Rate Inverse of T1 MM constant (K1R-1) Inverse of T0 MM constant (K0R-1) T0 autophosphorylation rate (k0a) T1 autophosphorylation rate (k1a) Yang Yang, Candidacy Seminar
Inverse of Methylation MM Constant Autophosphorylation Rate Inverse of T3 MM constant (K3R-1) Inverse of T2 MM constant (K2R-1) T2 autophosphorylation rate (k2a) T3 autophosphorylation rate (k3a) Yang Yang, Candidacy Seminar
Inverse of Methylation MM Constant Autophosphorylation Rate Inverse of LT1 MM constant (K1LR-1) Inverse of LT0 MM constant (K0LR-1) LT1 autophosphorylation rate (k1al) LT0 autophosphorylation rate (k0al) Yang Yang, Candidacy Seminar
Inverse of Methylation MM Constant Autophosphorylation Rate Inverse of LT3 MM constant (K3LR-1) Inverse of LT2 MM constant (K2LR-1) LT3 autophosphorylation rate (k3al) LT2 autophosphorylation rate (k2al) Yang Yang, Candidacy Seminar
Inverse of Demethylation MM Constant Autophosphorylation Rate Inverse of T2 MM constant (K2B-1) Inverse of T1 MM constant (K1B-1) T1 autophosphorylation rate (k1a) T2 autophosphorylation rate (k2a) Yang Yang, Candidacy Seminar
Inverse of Demethylation MM Constant Autophosphorylation Rate Inverse of T4 MIM constant (K4B-1) Inverse of T3 MM constant (K3B-1) T3 autophosphorylation rate (k3a) T4 autophosphorylation rate (k4a) Yang Yang, Candidacy Seminar
Inverse of Demethylation MM Constant Autophosphorylation Rate Inverse of LT2 MM constant (K2LB-1) Inverse of LT1 MM constant (K1LB-1) LT2 autophosphorylation rate (k2al) LT1 autophosphorylation rate (k1al) Yang Yang, Candidacy Seminar
Inverse of Demethylation MM Constant Autophosphorylation Rate Inverse of LT4 MM constant (K3LB-1) Inverse of LT3 MM constant (K2LB-1) LT4 autophosphorylation rate (k13) LT3 autophosphorylation rate (k12) Yang Yang, Candidacy Seminar
Methylation Catalytic Rate/Demethylation Catalytic Rate = Constant T1methylation catalytic rate T2methylation catalytic rate T1demethylation catalytic rate T2demethylation catalytic rate Yang Yang, Candidacy Seminar
Methylation Catalytic Rate/Demethylation Catalytic Rate = Constant T2methylation catalytic rate T3methylation catalytic rate T3demethylation catalytic rate T4demethylation catalytic rate Yang Yang, Candidacy Seminar
Methylation Catalytic Rate/Demethylation Catalytic Rate = Constant LT0methylation catalytic rate LT1methylation catalytic rate LT1demethylation catalytic rate LT2demethylation catalytic rate Yang Yang, Candidacy Seminar
Methylation Catalytic Rate/Demethylation Catlytic Rate = Constant LT2demethylation catalytic rate LT3demethylation catalytic rate LT3demethylation catalytic rate LT4demethylation catalytic rate Yang Yang, Candidacy Seminar
Summary • The Inverse of Methylation MM constants linearly decrease with Autophosphorylation Rates • The Inverse of Demethylation MM constants linearly increase with Autophosphorylation Rates • The ratio of Methylation catalytic rates and demethylation catlytic rates for the next methylation level is constant for all methylation states These conditions are consistent with those obtained in previous works from analysis of a detailed, two-state receptor model*. * B. Mello et al. Biophysical Journal , (2003). Yang Yang, Candidacy Seminar
Conditions in Two-State Receptor Model • Receptor autophosphorylation rates are proportional to the receptor activity: • Only the inactive or active receptors can be methylated or demethylated. The association rates between receptors and CheR or CheBp are linearly related to the receptor activity, whiledissociation rates are independent with 𝜆. Then the inverse of the methylation or demethylation MM constants are linearly related to the receptor activity: • The ratios between methylation catalytic rates and demethylation catalytic rates for the next methylation level are constant: • The phosphate transfer rates from CheA to CheB or CheY are proportional to receptor activities: Yang Yang, Candidacy Seminar
Summary of Protein Concentrations Yang Yang, Candidacy Seminar
Relationship Between Protein Concentrations (M) (M) (M) (M) Yang Yang, Candidacy Seminar
Relationship Between Protein Concentrations (cont’d) (M) (M) (M) (M) Yang Yang, Candidacy Seminar
Relationship between Protein Concentrations (cont’d) (M) (M) (M) (M) Yang Yang, Candidacy Seminar
Summary For more precise adaptation: CheR concentration is restricted in a narrow small-value region while total receptor and CheY concentration can vary in a wide region. CheR concentration is proportional to the CheB concentration For smaller or larger value of CheY concentration, total receptor concentration can vary in a wide region. CheB concentration is restricted in a narrow region while total receptor and CheY concentration can vary in a wide region.
Diversity of Chemotaxis Systems In different bacteria, additional protein components as well as multiple copies of certain chemotaxis proteins are present. Response regulator Phosphate “sink” Eg.,Rhodobacter sphaeroides, Caulobacter crescentus and several rhizobacteriapossess multiple CheYs while lacking of CheZ homologue. CheY2 CheY1 Yang Yang, Candidacy Seminar
Two CheY System Exact adaptation in modified chemotaxis network with CheY1, CheY2 and no CheZ: CheY1p (µM) CheY1p (µM) Time(s) • Requiring: • Faster phosphorylation/autodephosphorylation rates of CheY2 than CheY1 • Faster phosphorylation rate of CheB Time(s) Yang Yang, Candidacy Seminar
Conclusions • Successful implementation of a novel method for elucidating regions in parameter space allowing precise adaptation • Numerical results for (near-) perfect adaptation manifolds in parameter space for the E. coli chemotaxis network, allowing determination of • Conditions required for perfect adaptation, consistent with and extending previous works [1-3] • Numerical ranges for experimentally unknown or partially known kinetic parameters • Extension to modified chemotaxis networks, for example with no CheZ homologue and multiple CheYs [1] Barkai & Leibler, Nature (1997). [2] Yi et al., PNAS (2000). [3] Tu & Mello, Biophys. J. (2003). Yang Yang, Candidacy Seminar
Future Work • Extension to other signaling networks • vertebrate phototransduction • mammalian circadian clock • allowing determination of • parameter dependences underlying robustness of adaptation • b) plausible numerical values for unknown network parameters Yang Yang, Candidacy Seminar
Vertebrate Phototransduction • cGMP: cyclic GMP • PDE: cGMP phosphodiesterase • GCAP: guanylyl cyclase activating, Ca2+ binding protein • gc: guanylyl cyclase, which synthesis cGMP http://www.fz-juelich.de/inb/inb-1/Photoreception/ Yang Yang, Candidacy Seminar
Light Adaptation of Phototransduction An intracellular recording from a single cone stimulated with different amounts of light. Each trace represents the response to a brief flash that was varied in intensity. At the highest light levels, the response amplitude saturates. (Neuroscience, Purves et al., 2001) Yang Yang, Candidacy Seminar
Kinetic Model for Vertebrate Phototransduction Russell D. Hamer, Visual Neuroscience (2000) Yang Yang, Candidacy Seminar
Mammalian Circadian Clock From Forger et al., PNAS (2003). • PERs transport CRYs to nucleus • CLOCK and BMAL1 bind together • CLOCK·BMAL1 binds to E box to increase Pers(Crys) transcription rates • E box is the sequence CACGTG of the PER1 and CRY1 genes • PERs bind with kinases CKIε/δ to be phosphorylated • Phosphorylated PERs bind with CRYs • Only phosphorylated PER·CRY· CKIε/δ can enter nucleus • Phosphorylated PER·CRY· CKIε/δ inhibit the ability of CLOCK·BMALI to enhance transcription • Increasing REV-ERBα levels repress BMAL1 transcription • Activator positively regulated BMAL1 transcription http://www.umassmed.edu/neuroscience/faculty/reppert.cfm?start=0 Yang Yang, Candidacy Seminar