
Creating Shareholder Value
Creating Shareholder Value. Alan Jette – SVP Treasury & Balance Sheet Management Presentation to the ICPM 3 June 2008. Emperor Exposed – What Went Wrong?. The last year has been a wrecking yard of bank earnings, writedowns, and shotgun mergers to avoid bankruptcies / insolvencies. ABCP.

Creating Shareholder Value
E N D
Presentation Transcript
Creating Shareholder Value Alan Jette – SVP Treasury & Balance Sheet Management Presentation to the ICPM 3 June 2008
Emperor Exposed – What Went Wrong? • The last year has been a wrecking yard of bank earnings, writedowns, and shotgun mergers to avoid bankruptcies / insolvencies ABCP Fundamentally banks lost track of what creates shareholder value
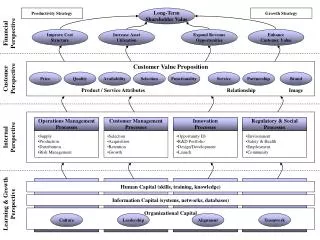
PositiveEconomic Profit ROE - Cost of Equity MV Shareholder Value 1 + = = BV Cost of Equity- Growth Sustainable Growth Stable Earnings Creating Shareholder Value • Bank’s create Shareholder Value Added (SVA) by adhering to a disciplined Risk Adjusted Performance Measurement (RAPM) process focusing on: • Risk adjusted earnings on Required Risk Based Capital • Generating stable, sustainable, growing earnings over time TD’s Intrinsic Value Formula
RAPM – Key Components • Components • Funds Transfer Pricing - assigns fully hedged cost of funds to all lending and deposit exposures • Expected Credit Loss Assessments for pricing and provisioning • Risk Based Capital Allocations • Differentiation between Productive and Non-Productive risk • Keys to Success • No exceptions or sacred cows • No internal arbitrage opportunities • No black boxes - full transparency of process, and results
Funds Transfer Pricing System • All loan and deposit positions transfer priced explicit cost of funds on a fully hedged, option adjusted funding basis • Liquidity premiums are assigned with an explicit term structure independent from market risk • Market and liquidity risk is transferred to treasury and managed centrally FTP allocates true funding costs and creates transparency of results
Expected Credit Loss and Risk Based Capital • Product pricing and provisioning should reflect fair “through the cycle” credit costs and a risk adjusted capital allocation calibrated to absorb extreme “tail” events Expected Credit Losses • Reflect through the cycle credit costs Credit Risk Capital • Calibrate “tail” to absorb true 1 in 2000 event (AA default prob) 2 cycle average 10yr avg Greater conservatism should be used for “untested” risks (Subprime)
Differentiate Between Productiveand Unproductive Risks Market Risk (non Trading) • Market risk is not a productive risk for a personal & commercial Bank • Exposures do not effectively leverage the retail franchise US Banks: “we have to take interest rate risk to make money” Theory: don’t need a retail bank infrastructure for investor to earn returns from market risk • Structural interest rate gap positions are an explicit position and view/bet on the market • Option Hedging • Locks in expected costs and eliminates potential for earnings variability • Does not create incremental costs • Reduces economic capital required
3. Differentiate Between Productive and Unproductive Risks Credit Risk • Organic credit risk is a productive risk for a Personal & Commercial Bank • Leverage the Bank’s franchise value to intermediate with individual customers • Creates excess spread relative to long run expected losses and capital costs • Wholesale credit exposures is more efficient and presents lower opportunities for risk adjusted returns • Securitization market • Purchased whole loan • Syndications
US Bank Strategies to IncreaseNominal Returns • Interest Rate Gap Carry Trade • Credit Carry Trade • Structured Products with Embedded Optionality
Classic Gap Trade Trap • Large Carry from Steep Yield Curve (2003-04) • Bank’s enticed to borrow short term and lend long • Earn substantial non-franchise earnings (some cases up to 40% of total) • Yield Curve Flattens and Carry Declines (2005) • Carry yield declines as short term roll-over borrowing costs rise • Doubles down carry volumes to main earnings contribution • Yield curve flat / inverted (2006-07) • Negative contribution to earnings • Locked into positions/losses as MV assets now less than MV liabilities • Exiting will realize remaining losses
Disappearing Gap NII leads to Credit Carry Trade • Pressure to replace declining gap earnings leads to credit carry • Investors demand QoQ earnings growth • ‘Non-Prime’ Mortgage products such as HELOC and 2nd Lien Mortgages offered large gross yields • Yields not properly risk adjusted for true credit risk and capital costs • 2007/08 – Mortgage market implodes • Other firms replaced gap carry losses with structured interest rate risk yields • Nominally positive yield carry is negative value on risk / option adjusted basis
What Went Wrong • Competitive pressures and market forces reduced core earnings growth • Banks implemented strategies to generate non-core, non-controllable sources of earnings • Inflated market valuations based on reported, nominal earnings growth created the need to sustain earnings over time • Lack of transparency as to sources of earnings • Lack of understanding and required disclosures around quality of earnings, balance sheet capacity utilization and liquidity risk by • Senior management 3-4 levels removed from risk taking • Boards • Shareholders • Regulators • Rating Agencies • Did boards understand the “type” earnings firms were generating? • Did shareholders understand the type of earnings they were valuing?
Structural Incentives - Regulatory • Regulatory capital rules distort economic incentives • Tier 1 Leverage Test establishes a floor capital to asset ratio • Creates minimum capital requirement and earnings hurdle regardless of risk based capital requirements • Banks penalized for operating a low credit risk strategy and rewarded for increasing risk • No capital related to non-credit risks such as structural interest rate risk
Structural Incentives - Compensation • Compensation schemes did not create the proper incentives • Standard compensation schemes focused on • Year over year EPS growth • Top line revenue growth • Performance targets short term and not aligned with creating shareholder value • UBS Shareholder Report Quote “ Structural incentives to implement carry trade: the UBS compensation and incentivisation structure did not effectively differentiate between the creation of alpha versus creation of return based on a low cost of funding” “Bonuses were measured against gross revenue … with no formal account taken of the quality or sustainability of those earnings”
Paying the Price • After the decline in Gap Earnings and loss of NII growth – US Bank’s still didn’t show price declines • Consolidation premiums actually increased • But now – buyers can’t afford and sellers too risky
Culture not Process TD Experience “It’s the culture of risk management which saves you” – CEO • Creating and maintaining franchise value is central to the kinds of risks you take and in what quantity • The retail bank franchise generates stable, predictable and sustainable core earnings that create economic profit and SVA • Its fundamental that if something generates an abnormal excess return it must have more risk than you are measuring – you are being transferred the risk • The culture must support the requirement for transparency and explainability of financial results
Culture not Process Danger Signs • Businesses earning high nominal income • Over reliance on equivalent exposure measures that don’t generate material need for capital on large notional positions • Securities that earn returns well in excess of stated risk profile • AAA CDO’s trading at L+100 • Strategies that rely on increasing balance sheet capacity to remain “hedged” Practical Constraints • Set “Dumb Limits” on exposure especially when tail risk is unknown • Don’t rely on outside evaluation of risk • Understand the drivers of excess (alpha) returns


![[PDF] DOWNLOAD Creating Shareholder Value: A Guide for Managers and Investors](https://cdn7.slideserve.com/12692975/slide1-dt.jpg)