Download
1 / 30
310 likes | 548 Views
HPLC Analysis of Surfactants (S 0 , S 1 , and S 2 ). Amir Amini, Clarence Miller, and George Hirasaki. Rice Consortium Meeting April 26, 2011. HPLC Columns. What Can HPLC Do For Us?. Measuring surfactant concentration Total surfactant concentration

E N D
HPLC Analysis of Surfactants(S0, S1, and S2) Amir Amini, Clarence Miller, and George Hirasaki Rice Consortium Meeting April 26, 2011
What Can HPLC Do For Us? • Measuring surfactant concentration • Total surfactant concentration • Individual concentration of components in a mixture • Separation of Mixtures • Thermal Stability • Quality Control
Method Development* • *Product manual for Acclaim Surfactant column from Dionex • **Acetonitril is preferred over methanol because it generates less back pressure on the column. • ***Temperature has little effect on the selectivity of surfactants. Higher temperature makes all the surfactants elute earlier.
Example: Triton X100 Analysis By Surfactant Column • 0.4 wt% Triton X100, Injection: 10 µL, Temperature 25oC, • Mobile Phase: 45% ACN / 55% Ammonium Acetate (50mM), Flow rate: 1 ml/min
Evaporative Light Scattering Detector (ELSD) • Mobile phase should be a solvent with low boiling point. • If any acids, bases and salts are used to modify mobile phase, they also need to be readily evaporated. • . • The intensity of the scattered light is a function of the mass of the scattering particles and generally follows a power-law relationship
PART IHPLC Analysis of S1 (old & new commercial samples as well as the lab sample), S0, and Their MixturesS1old sample (commercial): activity = 19.45 wt%S1new sample (commercial): activity = 19.45 wt%S1lab sample: activity= 84.32 wt%S0 labsample: activity = 85.50wt%S1 new / S0 lab mixture: (70 wt% S1, 30 wt% S0)
Motivation • Oil/brine/surfactant phase behavior using different samples of S1 as surfactant shows non-identical results • No middle-phase microemulsion (type III) was observed (direct transition from type I to II with increase of salinity) ! Are these surfactants the same? Constituent components of a surfactant may partition differently into the oil phase ? Can chromatographic separation occur when S1, S0 or their mixture is injected into the reservoir? Need a way to analyze these surfactants, both qualitatively and quantitatively
Experimental Conditions for HPLC Analysis of PART I • Mobile Phase: Acetonitrile (B) / DI water (A) • Column: C18 column at 25 oC • Flow Rate: 1mm/min • Sample Volume: 50 µL • Detector: Evaporative light scattering (ELSD) at 60 oC and 3.5 bar • Gradient: Linear 0/80/95/110 min with 40/60/80 /80 %B
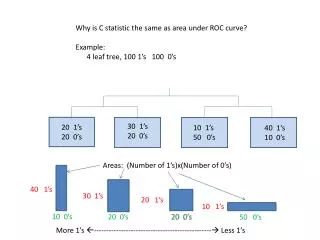
Area Under the ELSD Signal Curve Concentration ? Peak Area = a .(Concentration)b
old sample contains more of the salts (sulfates, …) and other hydrophilic components Q: origin? A: hydrolysis as indicated by the slightly acidic PH of the sample.
Lab sample hasmore of the high PO number and lessof the low PO number components
Components with lower number of PO groups elute earlier from the column
The mixture signal is NOTthe linear superposition of the individual components signal! Total areas are within 5% of each other: 16.8 vs16.0 V.min
PART IIHPLC Analysis of S1 (new commercial sample), S2, and Their MixtureS1new sample (commercial): activity = 19.45 wt%S2(commercial): activity = 22.38wt%S1 new / S2mixture: (90 wt% S1, 10 wt% S2)
Motivation • Composition of a blend of two surfactants may change as salinity changes (e.g. in phase behavior experiments) or as it interacts with rocks and oil (e.g. in core flooding experiments) • Evaluating the concentration of each component in S1 /S2 blend after : possible partitioning into oil phase, dynamic adsorption, core flood Can we separate a blend of two surfactants into their pure components ? How can we measure the concentration of each component? Need a way to analyze these surfactants, both qualitatively and quantitatively
Experimental Conditions for HPLC Analysis of PART II • Mobile Phase: Acetonitrile (B) / 100mM Ammonium Acetate, PH=5.5 (A) • Column: Surfactant column at 25 oC • Flow Rate: 1mm/min • Sample Volume: 50 µL • Detector: Evaporative light scattering (ELSD) at 60 oC and 3.5 bar • Gradient: Linear 0/60/80 min with 25/80/80 %B
Several gradient patterns were tried BUT surfactant column was not able to separate S1 and S2
S1 and S2 are separated! Now we can measure the concentration of S1 and S2 individually in their mixture
Conclusion • Composition changes in different batches of the same surfactant can be identified • Chromatographic separation of S1/S0 and S1/S2 may occur during surfactant flooding • Blends of S1 and S2 can be separated; this gives a way to measure the concentration of each of those components: • Analysis of oleic and aqueous phases to determine partitioning • Analysis of effluent in surfactant flooding, dynamic adsorption, etc.
Acknowledgement • Tiorco • Kinder Morgan • Addax
Gas waste to exhaust hood N2 Chemstation ELSD Liquid waste