Activity 40
Activity 40. Modeling with Exponential (Section 5.5, pp. 427-437) and Logarithmic Functions. Exponential Models of Population Growth:.

Activity 40
E N D
Presentation Transcript
Activity 40 Modeling with Exponential (Section 5.5, pp. 427-437) and Logarithmic Functions
Exponential Models of Population Growth: The formula for population growth of several species is the same as that for continuously compounded interest. In fact in both cases the rate of growth r of a population (or an investment) per time period is proportional to the size of the population (or the amount of an investment). Remark: Biologists sometimes express the growth rate in terms of the doubling-time h, the time required for the population to double in size:
Exponential Growth Model If n0 is the initial size of a population that experiences exponential growth, then the population n(t) at time t increases according to the model where r is the relative rate of growth of the population (expressed as a proportion of the population).
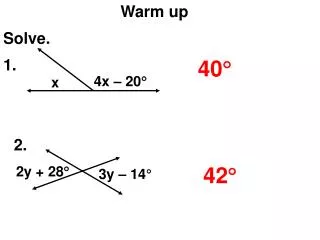
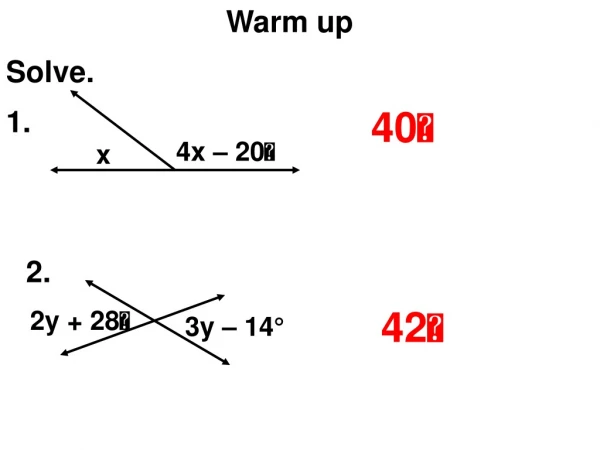
Example 1 (Frog Population): The frog population in a small pond grows exponentially. The current population is 85 frogs, and the relative growth rate is 18% per year. • Which function models the population after t years? • (b) Find the projected frog population after 3 years.
(c) When will the frog population reach 600? (d) When will the frog population double?
Example 2 (Bacteria Culture): • The initial count in a culture of bacteria (growing exponentially) was 50. The count was 400 after 2 hours. • What is the relative rate of growth of the bacteria population? %
Radioactive Decay Model: If m0 is the initial mass of a radioactive substance with half-life (the time required for half the mass to decay) h, then the mass m(t) remaining at time t is modeled by the function
Example 3: The mass m(t) remaining after t days from a 40-g sample of thorium-234 is given by: • How much of the sample will be left after 60 days?
(b) How long will it take for only 10-g of the sample remain?
Example 4: The half-life of cesium-137 is 30 years. Suppose we have a 10-g sample. How much of the sample will remain after 80 years?