Download
1 / 28
280 likes | 384 Views
Primary Production measurements over a daily cycle in Clarks Cove. Ayan Chaudhuri, Lin Zhang, Anne-Marie Brunner MAR640 – Global Marine Biogeochemistry. The aim of this experiment. Measuring primary productivity in Clarks Cove using

E N D
Primary Production measurements over a daily cycle in Clarks Cove Ayan Chaudhuri, Lin Zhang, Anne-Marie Brunner MAR640 – Global Marine Biogeochemistry MAR640 - Project
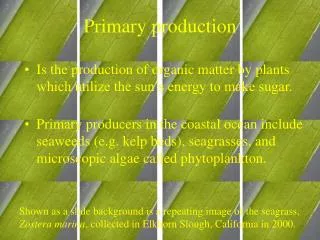
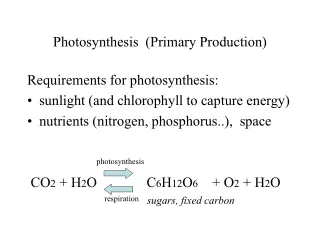
The aim of this experiment • Measuring primary productivity in Clarks Cove using • Light bottle/dark bottle technique to measure O2 with a Massspectrometer • d18O-Method • Organic Carbon and Nitrogen measurements • Nutrient measurements • establishing a box model for carbon fluxes in this Cove MAR640 - Project
Clarks Cove • It has an average water depth of 12ft (Very shallow) • remains well mixed by tidal and wind events year round • Hill, 1998 found nutrient levels lower in Buzzards Bay than in Narragansett Bay • Hill, 1998 for Buzzards Bay measured a primary productivity in Nov/Dec between 8-26mgC m-3h-1(his figure 18, station 6) MAR640 - Project Source: http://www.savebuzzardsbay.org
Measuring Primary Productivity –The Theory • Light Bottle/Dark Bottle Oxygen • a. Light bottle O2 minus initial O2 concentration is net community production. In the absence of heterotrophs, the difference is net primary production. • b. Dark bottle O2 concentration minus initial O2 concentration is respiration • c. Light bottle minus dark bottle is gross community production. • Incubation time: 3hrs • Sampling every 3 hours during the day, 5hours at night • Using a massspectrometer for higher accuracy MAR640 - Project
d18O-Method • During the incubation time the gross production produces O2 in the water with the same, enriched ratio as the water. Therefore, the ratio of 18O to 16O is enriched in the dissolved O2 pool, as the tagged O2 mixes with the large O2 pool. Thus, the change in the 18O of dissolved O2 can be used as a measurement of gross production. (Bender et al., 1987). The O2 consumed during respiration has a lower d 18O than the dissolved O2 • 18O/16O value of a gas with a d18O value, relative to SMOW (standard mean ocean water) would be 0.002005220. MAR640 - Project
Conversion to primary productivity • carbon (mg) * 32 * PQ = oxygen (mg) * 12; • where PQ = photosynthetic quotient, the ratio of moles of oxygen released to moles of carbon fixed; its value depends on whether nitrate or ammonia is available as a nitrogen source, and varies from 1.0 to 1.3; here 1.2 MAR640 - Project
Measuring Primary Productivity –The Experiment • Starting at 7am on the 30th of November we conducted the first sampling. Further sampling times were at 10am, 1pm, 4pm, 9pm, 2pm and 7am. • Light Bottles (not at 4, 9 and 2) , Dark Bottles and initial bottles were sampled and incubated in the seawater. • At the first sampling, also dark and light bottles for the daylight cycle (9hrs) were incubated. • Bottles were labeled with 18O and some samples with 13C for incubation. MAR640 - Project
Weather conditions were good, although cloudy, it was calm. At 2am,1st December, a storm started with increasing wind speeds and light drizzle until noontime, the second half of our experiment. Also, our setup for our bottle measurements started to fail around 2 am, so results are questionable during that time. Some data were lost for the bottles at 10am, 30th November. Jellyfish were seen in the sampled water Problems during the Experiment MAR640 - Project
Results • Light Bottle/Dark Bottle O2 measurements • 18O Results • Particulate Organic Matter Results • Nutrient Results MAR640 - Project
Bottle Measurements • Initial Bottle O2/Ar ratios, low at daybreak, moves up during the day, back to low at sunset and after. • Light Bottle O2/Ar ratios, rises during day, should fall to zero by sunset. • Dark Bottle O2/Ar ratios, falls during the day and rises after sunset MAR640 - Project
Calculations • GPP mostly negative • More respiration than production • Average pools all light, dark and initial bottles into respective means • NPP comparable to thesis by Hill MAR640 - Project
Summary • System as a whole is net heterotrophic • very less carbon is available for fixation • Sources - Tidal Inflow - Sediment re-suspension - atmospheric deposits Sinks - Tidal outflow MAR640 - Project
Del O18 Method • 450 uL of H2O enriched in 18O • The 18O enrichment of the dissolved O2 is taken to be a proportional measure of gross production • 9% enrichment – biased estimate MAR640 - Project
POM FILTER RESULTS Both Carbon and Nitrogen follow the tidal cycle, but results are biased After the onset of the storm. MAR640 - Project
C/N ratios Results are much higher than the classical Redfield Ratio of 6.6. Also Results behave contrariy to the tidal cycle and highest results are found At times with highest windspeeds. MAR640 - Project
d13C and d15N During incoming tide, both d increase and decrease with the arrival of the ebb. Notice the strong increase in d13C with during the high windspeed values during 1st December, 2004. MAR640 - Project
Results for the enrichment with 13C : A first order process is assumed to take place and simulate the procss Of primary productivity: d[C]/dt = -k*t with k= 0.03809102 hrs-1 MAR640 - Project
Results from a graph Carbon uptake: -8.082 mC m-3/hr MAR640 - Project
Increase in the incubated enriched d 13C MAR640 - Project
Box Model results Atmospheric input NPP=GPP-R Tidal flushing Benthos, Sediment resuspension MAR640 - Project
Atmospheric Deposition MAR640 - Project
NPP • 11mg C m-3 –hr or • with the light/dark bottle method, which resulted in an net primary productivity in the same range MAR640 - Project
Tidal Flushing • in one hour 2,357 m3 are replaced. The average Carbon Concentration during daylight hours, or the calm weather period was calculated to be 78.525 mg C m-3. • Tidal flushing of 1.5 days • strong dependence of the behavior with the tidal cycle. MAR640 - Project
Summary MAR640 - Project
Summary • Like theconcentrations of nutrients follow a daily cycle, the POM values generally coincident with a tidal cycle. However, the change of C/N values shows an opposite cycle to the tidal cycle, with incoming tides, the C/N ratio decreases, and increases with outgoing tides. The above results lead to a conclusion that the phytoplanktons carry out photosynthesis when there is available light and consume the nutrients in the seawater based on the Redfield ratio. So the concentrations of nutrients decrease during the day as we got from the experiment. But POM values didn’t increase as expected when there is photosynthesis. In the night, phytoplanktons consume O2 and release CO2, the concentrations of nutrients increased due to no consumption. There should be some productivity in the Cove from the above results. MAR640 - Project
Summary • The results of quad method show some interesting differences. The O2/Ar ratio in the initial bottle increases during the day which means there is O2 released and decreases in the night which means respiration leads to a decreasing of O2. However, the ratio from light bottles is always increasing during the experiment period, indicating discrepancies during measurement. The result from dark bottles is also beyond expectation. The ratios dipped from a significant high all through the day, however steadily rising by evening. The whole results show a common trend in that the entire system seems to have more respiration than production, Which is totally opposite to the nutrients and POM analysis. MAR640 - Project