Download

1 / 22
220 likes | 465 Views
Equipment Service Life Revisited EFCOG Infrastructure Management Working Group Annual Meeting, October 17-19, 2006 Oak Ridge, Tennessee Lawrence Livermore National Laboratory Whitestone Research. LLNL equipment renewal costs are substantially lower than comparative experience . Source: LLNL.

E N D
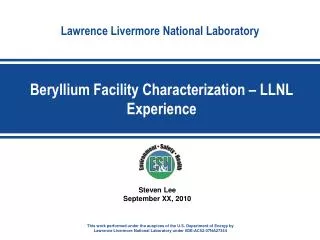
Equipment Service Life RevisitedEFCOG Infrastructure Management Working Group Annual Meeting, October 17-19, 2006Oak Ridge, TennesseeLawrence Livermore National LaboratoryWhitestone Research
LLNL equipment renewal costs are substantially lower than comparative experience Source: LLNL Why?
Maintenance Renewal definition= • Replacement of subsystems/components in kind that have reached the end of their useful life • Replacement in kind does not include upgrade/modification • About 20% of our maintenance budget goes to maintenance renewal • Maintenance & Repair + 1.6% of RPV • Maintenance Renewal + .5% of RPV +2.1% of RPV Current maintenance paradigm is to maintain subsystems until they reach their design/service life and then replace them
Project Overview • NNSA-funded project to analyze extended equipment service lives in partnership with LLNL • Actual experience at LLNL suggests service lives of equipment exceeding those of current DOE guidance • Estimating capital expenditures relies on accurate service life assumptions • Current service life estimates do not consider equipment still in service
Survivor Curve Analysis • Uses an actuarial approach • Includes data for subsystems that are still in service (right censored data) • Shows the percentage of subsystems surviving in relation to subsystem’s age • Provides a distribution rather than a simple average • Had many observations (N=24,883) sufficient for meaningfull results in over 12 asset types
Literature on equipment life • Survivor curve analysis used for computing equipment service lives (Winfrey, 1935) • Weibull statistical functions developed and used for reliability and equipment service life analysis (Weibull, 1968) • ASHRAE published survey-based life tables since 1978, but discredited by Hiller (2000) - did not consider equipment still in service • Secondary sources are imprecise (R.S. Means, Whitestone) • ASHRAE/ORNL demonstrates survivor curve methods (Abramson, 2005)
Hypothesis: Extending service life reduces maintenance costs • Forecast service life with equipment condition verification • Consistent maintenance forestalls wear out failures • Renewal decisions should be made on failure distribution, not average service life • Traditional service life determinations ignore equipment still in use Two “new” concepts
Estimation of Survivor Curves • Includes data for assets still in service • Used both polynomial and Weibull functions to fit curves • Provides distribution in addition to point estimate
The Second Concept: Make decisions on failure distributionBelief: Replace equipment when it reaches it’s expected service lifeResult: Loose the Right side of the Curve
All Subsystems DOE Recommended Service Life 19 LLNL Recommended Service Life 27 LLNL Average Mortality 31 LLNL Estimated Service Life 42
Estimated Cost Avoidance for LLNL • Equipment replacements exceed DOE service lives by 66% • Cost avoidance = $82.6 M • Equipment still in service exceeds by 97% • Cost avoidance = $181.3 M • Total estimated cost avoidance = $263.9 M
Contributing factors towards longer LLNL service lives: • Complete and consistent maintenance schedule • Regular condition assessments • Replace equipment on down slope of failure distribution
LLNL M&R costs are relatively level LLNL does not have extended time series or M&R costs for individual assets
Conclusions • Costly replacements can be delayed by continued effective maintenance • Potential savings are considerable • Service lives should be re-estimated using actuarial techniques • Impacts on service call frequency and equipment efficiency unknown • Case studies needed for detailed life cycle cost analysis
ASHRAE/ORNL survivor curve analysis for office sample Source: Abramson, 2005