Download
1 / 44
440 likes | 463 Views
QPF statistical properties and verification of COSMO models over Italy. Maria Stefania Tesini Carlo Cacciamani & Tiziana Paccagnella 11th COSMO General Meeting 7-11 September 2009, Offenbach. Motivation.

E N D
QPF statistical properties and verification of COSMO models over Italy Maria Stefania TesiniCarlo Cacciamani & Tiziana Paccagnella 11th COSMO General Meeting 7-11 September 2009, Offenbach
Motivation • Observed precipitation fields show a high variability both in space and time and the amount of rainfall could vary a lot within a short distance • High Resolution models seem to be able to reproduce this variability, even if frequent positioning errors in time and space make difficult a grid-point based employment of models QPF • In order to appreciate the properties and the additional information provided by LAMs respect to coarser resolution models we devised a strategy based on the aggregation of the observed values and forecasted values that fall within a predefined geographical area • In this work we present various approaches to QPF validation, focusing our attention on the behaviour of the COSMO implementations that run operationally at ARPA-SIMC (COSMO-I7 and COSMO-I2), in comparison with the global model IFS-ECMWF COSMO MEETING 2009
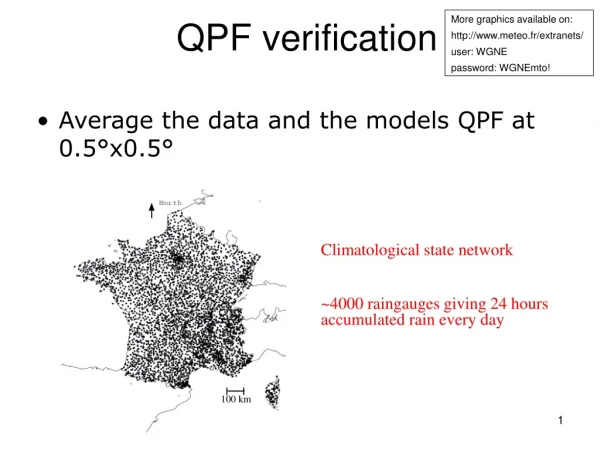
Dataset 24 hours accumulated precipitation (00-24 UTC or 6-6 UTC) • OBSERVATION: • More than 1000 rain-gauges provided by • Italian Department of Civil Protection network • COSMO dataset • Meteo Swiss (SON2008) Non homogeneous dataset both in space and time • MODELS: • 00 UTC run • +24h or +6h to +30h forecast • COSMO-I7 ~ 7 km h.r. • COSMO-I2 ~ 2.8 km h.r. • IFS-ECMWF ~ 25 km h.r. * * run 12 UTC (+12h to +36h) and ~ 50 km h.r. before 2006 COSMO MEETING 2009
observation models Methodology • The domain is divided in squared areas (boxes) of chosen size • The values of all stations and of all model grid-points that fall in the same box are aggregated and processed essentially using two different approaches Evaluation of a summarizing value for the precipitation field in each box:- mean - maximum- 90 th percentile- …. Study of the distribution function of the precipitation filed in each box COSMO MEETING 2009
Quality of the forecast: Verification Scores • Size of the boxes: 0.5° x 0.5° • Selected in order to contains 4 ECMWF grid-points • variable number of grid-points for COSMO models • COSMO-I7 ~ 40 – 45 grid-points • COSMO-I2 ~ 270 - 290 grid-points • Each box should contain at least 3 stations points to be considered in the computation • Definition of the event:the mean value (or the maximum value) in the box exceed a threshold • 1 mm/24h - 5 mm/24h - 10 mm/24h - 20 mm/24h • Creation of the contingency table • Evaluation of verification scores COSMO MEETING 2009
COSMO-I2 ECMWF COSMO-I7 SON 2008 - Mean precipitation > 1mm/24h COSMO MEETING 2009
COSMO-I2 ECMWF COSMO-I7 SON 2008 - Mean precipitation > 20 mm/24h COSMO MEETING 2009
COSMO-I2 ECMWF COSMO-I7 SON 2008 - Max precipitation > 20 mm/24h COSMO MEETING 2009
Distribution function of precipitation • Assessment of observed and forecasted precipitation “climatology” over well-defined areas by the study of the distribution function (pdf) • Estimation of the pdf of observed/predicted precipitation field taking in account all the points that fall within each area throughout the examined periods • The size of the boxes is 1°x1° in order to have enough forecast and observation points to perform significant statistics • The boxes have been selected on the basis of orographic features so that we assume that the precipitation in each of these points is roughly equi-probable COSMO MEETING 2009
Autumns 2005 & 2007OBSERVATION North-West North Appenine N-East Centre of Italy Sout of Italy Sardinia 99 th perc 90 th perc COSMO MEETING 2009
Autumns 2005 & 2007 COSMO-I7 North-West North Appenine N-East Centre of Italy Sout of Italy Sardinia COSMO MEETING 2009
Autumns 2005 & 2007ECMWF North-West North Appenine N-East Centre of Italy Sout of Italy Sardinia COSMO MEETING 2009
Amount of precipitation in a season • Evaluation of the daily mean (max) in each box for models and observations • Accumulation of the daily mean (max) over the “common” days • Domain divided in a grid of boxes of different size, in this case • 0.5° x 0.5° • required at least 3 stations in each box • ECMWF 4 points • COSMO-I7 ~ 40 – 45 points • COSMO-I2 ~ 270 - 290 points COSMO MEETING 2009
COSMO-I2 COSMO-I7 ECMWF OBS SON 2008 - Seasonal sum of daily (6-6UTC) MEAN precipitation Box size0.5° x 0.5° COSMO MEETING 2009
COSMO-I2 COSMO-I7 ECMWF OBS SON 2008 - Seasonal sum of daily (6-6UTC) MAX precipitation Box size0.5° x 0.5° COSMO MEETING 2009
COSMO-I2 COSMO-I7 ECMWF OBS MAM 2009 - Seasonal sum of daily (00-24 UTC) MEAN precipitation Box size0.5° x 0.5° COSMO MEETING 2009
COSMO-I2 COSMO-I7 ECMWF OBS MAM 2009 - Seasonal sum of daily (00-24 UTC) MAX precipitation Box size0.5° x 0.5° COSMO MEETING 2009
Day-by-day behaviour: qualitative description • Investigation of models ability in reproducing the day-by-day variability of the precipitation field inside a selected area • The precipitation values of all model grid-points and of all rain-gauges that fall within the chosen area are taken into account to evaluate the respective distribution functions • Size of the selected areas: 0.5°x 0.5° COSMO MEETING 2009
APRIL 2009 - Daily distribution COSMO MEETING 2009
ECMWF COSMO-I7 COSMO-I2 OBS APRIL 2009 - Daily distribution COSMO MEETING 2009
APRIL 2009 - Daily distribution COSMO MEETING 2009
ECMWF COSMO-I7 COSMO-I2 OBS APRIL 2009 - Daily distribution COSMO MEETING 2009
APRIL 2009 - Daily distribution COSMO MEETING 2009
ECMWF COSMO-I7 COSMO-I2 OBS APRIL 2009 - Daily distribution COSMO MEETING 2009
APRIL 2009 - Daily distribution COSMO MEETING 2009
ECMWF COSMO-I7 COSMO-I2 OBS APRIL 2009 - Daily distribution COSMO MEETING 2009
APRIL 2009 - Daily distribution COSMO MEETING 2009
APRIL 2009 - Daily distribution COSMO MEETING 2009
Amount of precipitation in a season (2) • Evaluation of the daily mean in each box for models and observations • Accumulation of the daily mean over “common” days • grid of boxes of size • 0.25° x 0.25° • required at least 1 station in each box • ECMWF 1 points • COSMO-I7 ~ 9 – 12 points • COSMO-I2 ~ 50 - 60 points • Useful tools to compare models COSMO MEETING 2009
MAM 2008 – Models comparison COSMO MEETING 2009
MAM 2008 – Models comparison COSMO MEETING 2009
MAM 2008 – Models comparison COSMO MEETING 2009
MAM 2008 – Models comparison COSMO MEETING 2009
SON 2008 – Models comparison COSMO MEETING 2009
SON 2008 – Models comparison COSMO MEETING 2009
SON 2008 – Models comparison COSMO MEETING 2009
SON 2008 – Models comparison COSMO MEETING 2009
MAM 2009 – Models comparison COSMO MEETING 2009
MAM 2009 – Models comparison COSMO MEETING 2009
MAM 2009 – Models comparison COSMO MEETING 2009
MAM 2009 – Models comparison COSMO MEETING 2009
Conclusion • We approached the validation of models QPF using basically a descriptive approach • The non-homogeneous dataset and the strong dependence on geographical position make difficult summarizing the results • However the methodologies used had pointed out additional value of High Resolution models: • Improvements are more evident when the maximum value of precipitation in a box is investigated (e.g. high localized events) • The distribution functions (both on a seasonal or daily basis) of the COSMO models seem to be more realistic than that of ECMWF • The features of the pdf of observation , and in particular the spread of the tail of the distribution, seem to be reasonably well reproduced by the COSMO models (maybe COSMO-I2 better than COSMO-I7) • On the other hand, the spread of ECMWF pdf do not cover all the range of the observed values COSMO MEETING 2009
Conclusion • The comparison of the seasonal amount of rain for the three models had pointes out significant differences in the pattern of the precipitation fields • Increasing resolution add more orographics details • COSMO-I2 seemed to be more “dry” in some region and more “wet” in other (dry upwind and wet downwind ….to be investigated) COSMO MEETING 2009
Thanks for your attention COSMO MEETING 2009