Download
1 / 49
490 likes | 855 Views
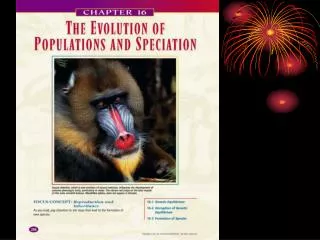
Explore what defines a species, how they are classified, the causes of genetic variations, and the impact of Hardy-Weinberg equilibrium in population genetics and speciation. Understand the factors influencing genetic frequency within populations.

E N D
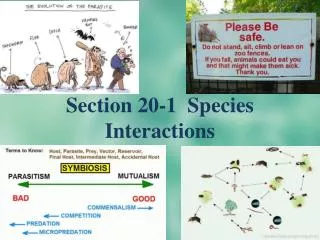
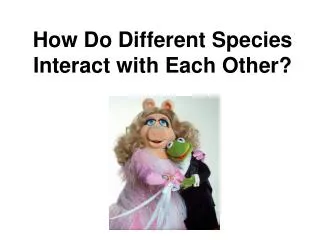
What is a species? • a species is a population of organisms that can successfully interbreed but cannot breed with other groups. • How do we classify species? • By a species morphology-internal and external structure and appearance • Why do we have different species? • What causes different species?
Chapter 16 & 17population genetics and speciation • What causes variation within a population? • Environmental factors (amount of food) • Heredity • Gene pool—total genetic information available in a population
Hardy-Weinberg is used to predict phenotype frequency • Phenotype frequency = # individuals w/ trait total individuals in population If 2 alleles for color A = red, or pink AA – red Aa - pink a = white aa – white We want frequency of A or a
To be red RR so you have 2 “R” To be pink Rr you have 1 “R” and 1 “r” To be white you have 2 “r” Above you have 12 “R” out of 18 possible 12/16 = 0.75 you have 4 “r” out of 18 4/16 = 0.25 Probability of RR = frequency of R x frequency of R (r x r) = 0.75 x 0.75 = 0.5625 (0.25 x 0.25 = 0.0625
Hardy- Weinberg P2 + 2pq + q2 = 1 Frequency of RR freq of Rr freq of rr R x R R x r r x r 0.75 x 0.75 ( 0.75 x 0.25 ) 0.25 x 0.25 = 1 0.5625 + 2(0.1875) + 0.0625 .5625 + .375 + .0625 = 1 p + q = 1
Tall is dominant and short is recessive What is the frequency if 50 were tall and 30 were short? remember p + q = 1 50 + 30 = 80 x 2 alleles = 160 letters q = tt = 60 p = TT or Tt = 100 but don’t know p + 60/160 = 1 p + .375 = 1 p = .625 Now plug into P2 + 2pq + q2 = 1 -to find frequency of TT, Tt, tt
Use hardy-Weinberg to predict frequency of alleles from generation to generation • Genotype frequencies remain the same unless acted upon by outside influences. ASSUME • Mutations don’t alter gene pool • Mating is random • Population is VERY large • Individuals don’t enter or leave the population • Natural selection doesn’t occur (no one dies 1st )
Disruption of genetic equilibrium We know Hardy-Weinberg assumptions cannot stand • Mutations occur changes gene pool • Gene flow individuals move in/out of populations • Immigration= move into • Emigration = move out • Genetic drift – random events occur (disease, natural disaster) • Not really seen in large population • Major impact in small population
Nonrandom mating-mating is really not random ….based on geographic location • Sexual selection—males usually brightly colored to attract females • shows females males have GOOD traits so pick me!!
5. Natural Selection • Is really ongoing so disrupts genetic equilibrium 3 types • Stabilizing selection—individuals with average trait have highest fitness • Extreme traits have lower fitness • Larger than average lizards “stick” out more • Smaller may not be able to run fast enough to escape
Disruptive selection-individuals with extreme variations have greater fitness-average “stick out” • Directional selection - individuals with extreme variations have greater fitness -pull average to extreme variation
Leopard frog Wood frog What separates these two species? Leopard frog breeds between beginning of April through late April. Wood frog breeds mid March through mid April.
What is the goal of this game? What obstacles must the frog overcome?
What will happen to this particular frog population if frogger can’t make it across the road? Stream? This is called geographic isolation
Geographic Isolation • Geographic isolationresults from the separation of population subgroups by geographic barriers. This could be: -road -Deep canyon -body of water -anything an organism can not cross!!
Allopatric Speciation Geographic isolation may lead to allopatric speciation. • Different “homelands” • Species no longer share the same gene pool • More likely to occur in small populations • Possibly over time the species will no longer be able to reproduce= reproductive isolation
Sympatric speciation • Reproductive isolation within the same geographic area
Sympatric speciation Species adapt to different niches & no longer mate • One group of lizards prefers life on the ground, and the other prefers life in the tree • Eventually they don’t “find” each other to mate
Sympatric speciation Species adapt to different niches & no longer mate The red color of Mimulus cardinalis attracts hummingbirds but goes unnoticed by bumblebees. Bumblebees prefer the pale pink petals of Mimulus lewisii, which in turn are unpopular with birds.
The monkeyflower Mimulus lewisii • is usually pink and pollinated by bees (left). One mutated gene, which is responsible for the yellow-orange petals (right), causes the bees to drop their visits and hummingbirds to pollinate the plant.
Rates of Speciation • In the gradual model of speciation (gradualism), species undergo small changes at a constant rate. (over a few million years) • Under punctuated equilibrium, new species arise abruptly, differ greatly from their ancestors, and then change little over long periods. (over thousands of years)
What do you notice? Look at wing color
Concept map Natural selection in a population That can be subjected to reproductive barriers Can be separated geographically during Geographic isolation Reproductive isolation Can lead to new species during speciation
Chapter 17 Classification of organisms • 17.1 Biodiversity • Taxonomy- science of describing, naming, and classifying organisms • Aristotle was 1st to classify but system had problems • Based on where organism lived—land, water, air
Aristotle All Organisms All Organisms Animals Plants Air Land H2O Structure Size
All Organisms Animals Plants Fish Rabbit Robin Air Land H2O
All Organisms Animals Plants Duck ?? Turtle ?? Alligator ?? Air Land H2O
Linnaean System • Devised naming system using 2 names • Binomial nomenclature • Used hierarchy of organization
Levels of Classification • Organisms are grouped by shared characteristics from very broad to more specific groups. • The more classification levels that two organisms share, the more characteristic they have in common. • Example: shoes
Levels of Classification 1. Domain Humans 2. Kingdom Animalia 3. Phylum Chordata 4. Class Mammalia 5. Order Primata 6. Family Hominidae 7. Genus Homo 8. Species sapiens King Phillip Came Over From Gulf Shores
Systematics 17.2 • Phylogenetics—analysis of evolutionary relationships among organisms • This is based on several pieces of information or evidence • Visible similarities between living organisms and fossils • Compare embryonic development • Compare similar chromosomes, macromolecules-DNA • Use homologous NOT analogous structures • These phylogenetic diagrams or trees are hypothesis showing how organisms are related (can be changed as new evidence is added
Cladistics • Cladistics uses shared, derived characters as the only criterion for grouping taxa. • Shared-all members have in common • Derived-feature that evolved only w/I the group
Cladogram: Major Groups of Plants Outgroup – want all ?’s to be NO
Plane, car, feet, bike, motorcycle feet motorcycle car plane bike
Cladogram • Molecular Cladistics • Molecular similarities (such as similar amino acid or nucleotide sequences), as well as chromosome comparisons, can help determine common ancestry. • Chromosomes • Analyzing karyotypes can provide more information on evolutionary relationships.
Questions • What is the evolutionary history of a species called? • Phylogeny • What is the term for a clsassification system based on shared, derived characteristics? • Cladistics • Name 2 types of info used to classify organisms. • Visible similarities, embryonic, chromosomes, DNA
Questions • How could a biologist use cladistics to determine whether the flippers of a sea lion and a whale are homologous or analogous? • Study bones and fossils of both to determine if homologous or analogous.
Modern Classification 17.3The Tree of Life • Revising the Tree • The phylogenetic analysis of rRNA nucleotide sequences by Carol Woese led to a new “tree of life” consisting of three domains aligned with six kingdoms.
Modern classification17.3 • Organisms divided into domains and Kingdoms. • 3 Domains • Bacteria • Archea • Eubacteria
Domain Bacteria • Domain Bacteria • Domain Bacteria aligns with Kingdom Eubacteria, which consists of single-celled prokaryotes that are true bacteria.
Three Domains of Life, • Domain Archaea • Domain Archaea aligns with Kingdom Archaebacteria, which consists of single-celled prokaryotes that have distinctive cell membranes and cell walls.
Three Domains of Life, • Domain Eukarya • Domain Eukaryaincludes the kingdoms Protista, Fungi, Plantae, and Animalia. • All members of this domain have eukaryotic cells.