Download
1 / 46
460 likes | 483 Views
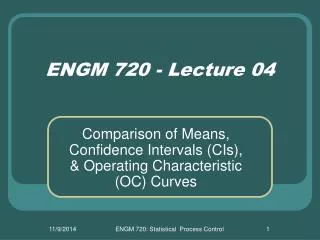
ENGM 720 - Lecture 07. X-bar, R, & S Control Charts; ARL & OC Curves. Assignment:. Reading: Chapter 5 Start & Finish reading Chapter 6 Spring Break means reading statistics on the beach, right? Assignments: Obtain the draft Ctrl Chart Factors table from Materials Page

E N D
ENGM 720 - Lecture 07 X-bar, R, & S Control Charts; ARL & OC Curves ENGM 720: Statistical Process Control
Assignment: • Reading: • Chapter 5 • Start & Finish reading • Chapter 6 • Spring Break means reading statistics on the beach, right? • Assignments: • Obtain the draft Ctrl Chart Factors table from Materials Page • Access Excel Template for X-bar, R, & S Control Charts: • Download Assignment 5 for practice • Use the Excel sheet to do the charting, and verify your hand calculations ENGM 720: Statistical Process Control
Statistical Quality Control and Improvement Improving Process Capability and Performance Continually Improve the System Characterize Stable Process Capability Head Off Shifts in Location, Spread Time Identify Special Causes - Bad (Remove) Identify Special Causes - Good (Incorporate) Reduce Variability Center the Process LSL 0 USL Process for Statistical Control Of Quality • Removing special causes of variation • Hypothesis Tests • Ishikawa’s Tools • Managing the process with control charts • Process Improvement • Process Stabilization • Confidence in “When to Act” ENGM 720: Statistical Process Control
UCL 0 CL LCL 0 Sample Number 2-Sided Hypothesis Test Sideways Hypothesis Test Shewhart Control Chart 2 2 2 2 Moving from Hypothesis Testing to Control Charts • A control chart is like a sideways hypothesis test • Detects a shift in the process • Heads-off costly errors by detecting trends ENGM 720: Statistical Process Control
Test of Hypothesis • A statistical hypothesis is a statement about the value of a parameter from a probability distribution. • Ex. Test of Hypothesis on the Mean • Say that a process is in-control if its’ mean is m0. • In a test of hypothesis, use a sample of data from the process to see if it has a mean of m0 . • Formally stated: • H0: m = m0(Process is in-control) • HA: m ≠ m0(Process is out-of-control) ENGM 720: Statistical Process Control
Test of Hypothesis on Mean (Variance Known) • State the Hypothesis • H0: m = m0 • H1: m ≠ m0 • Take random sample from process and compute appropriate test statistic • Pick a Type I Error level (a) and find the critical value za/2 • Reject H0 if |z0| > za/2 ENGM 720: Statistical Process Control
UCL and LCL are Equivalent to the Test of Hypothesis • Reject H0 if: • Case 1: • Case 2: • For 3-sigma limits za/2 = 3 ENGM 720: Statistical Process Control
Two Types of Errors May Occur When Testing a Hypothesis • Type I Error - a • Reject H0 when we shouldn't • Analogous to false alarm on control chart, i.e., • point lays outside control limits but process is truly in-control • Type II Error -b • Fail to reject H0 when we should • Analogous toinsensitivityof control chart to problems, i.e., • point does not lay outside control limits but process is never-the-less out-of-control ENGM 720: Statistical Process Control
Choice of Control Limits:Trade-off Between Wide or Narrow Control Limits • Moving limits further from the center line • Decreases risk of false alarm, BUT increases risk of insensitivity • Moving limits closer to the center line • Decreases risk of insensitivity, BUT increases risk of false alarm ENGM 720: Statistical Process Control
Consequences of Incorrect Control Limits • Bad Thing 1: • A control chart that never finds anything wrong with the process, but the process produces bad product • Bad Thing 2: • Too many false alarms destroy the operating personnel’s confidence in the control chart, and they stop using it ENGM 720: Statistical Process Control
Differences in Viewpoint Between Test of Hypothesis & Control Charts ENGM 720: Statistical Process Control
Example: Part Dimension • When a process is in-control, a dimension is normally distributed with mean 30 and std dev 1. Sample size is 5. Find the control limits for an x-bar chart with a false alarm rate of 0.0027. • r.v. x - dimension of part • r.v. x - sample mean dimension of part ENGM 720: Statistical Process Control
Distribution of x vs. Distribution of x ENGM 720: Statistical Process Control
Ex. Part DimensionCont'd • Find UCL: • The control limits are: ENGM 720: Statistical Process Control
Ex. Modified Part Limits • Consider an in-control process. A process measurement has mean 30 and std dev 1 and n = 5. • Design a control chart with prob. of false alarm = 0.005 • If the control limits are not 3-Sigma, they are called "probability limits". ENGM 720: Statistical Process Control
General Model:Shewhart Control Chart • Suppose x is some quality characteristic, and w is a sample statistic of x. • Suppose mean of w is μw and std dev of w is σw, then: • UCL = μw + Lσw • CL = μw • LCL = μw – Lσw • where L is the “distance” of the control limits from the center line, and expressed in multiples (units) of the standard deviation of the statistic, i.e. σw. • This type of chart is called a Shewhart Control Chart ENGM 720: Statistical Process Control
Rational Subgroups • Subgroups / Samples should be selected so that if assignable causes are present: • Chance for differences betweensamples is maximized • Chance for differences within a sample is minimized • Use consecutive units of production • Keep sample size small so that: • New events won’t occur during sampling • Inspection is not too expensive • But size is large enough that x is normally distributed ENGM 720: Statistical Process Control
X-bar X-bar X-bar R R R Why Monitor Both Process Mean and Process Variability? Process Over Time Control Charts ENGM 720: Statistical Process Control
Causes of Variation: Assignable / Special Causes Keep the process from operating predictably Things that we can do something about Common / Chance Causes Random, inherent variation in the process Meaning of Control: In Specification Meets customer constraints on product In Statistical Control No Assignable Causes of variation present in the process Teminology ENGM 720: Statistical Process Control
Statistical Basis of x Chart • Suppose a quality characteristic is x ~ N(m, s) and we know m and s • If x1, x2, …, xn is a random sample of size n then:and • Recall that the probability is that either: or ENGM 720: Statistical Process Control
Statistical Basis of x ChartCont'd • which is equivalent to: • Where LCL and UCL are the lower and upper control limits, respectively • In practice, one must estimate m and s from data coming from anin-controlprocess ENGM 720: Statistical Process Control
Statistics of the Range • R – the range – is a sample statistic • If x1, x2, …, xn is a random sample of size n from a normal distribution then one can estimate using the range: • where d2 is a function of n and can be found in Appendix VI • Can get a better estimate for if using more than one sample • Compute Rifor each of m samples where i = 1, …, m • Then use the sample average of Ri ENGM 720: Statistical Process Control
Computing Trial Control Limits for x Chart • Assume a quality characteristic x ~ N(m, s) • Take m 20 samples of size n = 4, 5, or 6 • For each sample i, compute x and Ri for i = 1, …, m • Compute: x and R ENGM 720: Statistical Process Control
Computing Trial Control Limits for x Chart • General model for x chart • Substituting estimates for μx and σxand using 3-sigma limits: • Where A2 comes from Appendix VI and depends on n ENGM 720: Statistical Process Control
Computing Trial Control Limits for R - Chart • x and R charts come as a pair • General model for R chart • Substituting estimates for mR and sR and using 3-sigma limits ENGM 720: Statistical Process Control
Computing Trial Control Limits for R - Chart (continued) • where and • D3 and D4 are tabulated in Appendix VI and depend on n • NOTE: R chart is quite sensitive to departures from normality ENGM 720: Statistical Process Control
Control Chart Factors Table (Appendix VI – see Materials Page for Engineering Notebook Copy) • For a constant sample size (n) and 3σ limits: Table factors derived from Montgomery,D.C., (2005) Statistical Quality Control, 5th Ed. ENGM 720: Statistical Process Control
Trial Control Chart Limits:Guidelines for Sampling • Sample should be of size 3 to 8 (sizes 4 – 6 are more common) • Sample must be homogeneous • same time (consecutive units) • same raw materials • same operator • same machine • Time may pass between samples but not within samples ENGM 720: Statistical Process Control
Steps for Trial Control Limits • Start with 20 to 25 samples • Use all data to calculate initial control limits • Plot each sample in time-order on chart. • Check for out of control sample points • If one (or more) found, then: • Investigate the process; • Remove the special cause; and • Remove the special cause point and recalculate control limits. • If can’t find special cause - drop point & recalculate anyway ENGM 720: Statistical Process Control
Control Chart Sensitizing Rules • Western Electric Rules: • One point plots outside the three-sigma limits; • Eight consecutive points plot on one side of the center line; • Two out of three consecutive points plot beyond two-sigma warning limits on the same side of the center line; or • Four out of five consecutive points plot beyond one-sigma warning limits on the same side of the center line. • If chart shows lack of control, investigate for special cause ENGM 720: Statistical Process Control
UCL UCL UCL UCL x x LCL LCL LCL LCL Rule 2 Rule 4 Rule 1 Rule 3 x x Control Chart Examples ENGM 720: Statistical Process Control
Control Chart Sensitizing Rules • Additional Sensitizing Rules: • One or more points very near a control limit. • Six points in a row steadily increasing or decreasing. • Eight points in a row on both sides of the center line, but none in-between the one-sigma warning limits on both sides of the center line. • Fourteen points in a row alternating above and below the center line. • Fifteen points in a row anywhere between the one-sigma warning limits (including either side of the center line). • Any unusual or non-random pattern to the plotted points. ENGM 720: Statistical Process Control
Charts Based on Standard Values, x Chart • If values for m and s are known(i.e., do not need to estimate from data) • Quantity A is tabulated in Appendix VI ENGM 720: Statistical Process Control
R - Chart Based on Standard Values • If values for R and s are known • We define a random variable W = R / s – called the relative range • The parameters of the distribution of W are a function of sample size (n): • From the relative range we can compute the mean of R ENGM 720: Statistical Process Control
The Standard Deviation of R • The standard deviation of R is given as: (Text does not derive this) • therefore • where • D1 and D2 are constants tabulated in Appendix VI • Caution: Be careful when using standard values • make sure these values are representative of the actual process ENGM 720: Statistical Process Control
The X-Bar Chart checks variability in locationbetween samples The R-Chart checks for changes in sample variation UCL UCL LCL LCL Sample Number Sample Number X-Bar ( Means ) Control Chart R - ( Range ) Control Chart x R X-Bar & R-Charts ENGM 720: Statistical Process Control
X-Bar Control Limits: Approximate 3 limits are found from S & table Sigma-Chart Control Limits: Approximate, asymmetric 3 limits from S & table X-Bar & Sigma-Charts • Used when sample size is greater than 10 ENGM 720: Statistical Process Control
X-Bar Control Limits: Approximate 3 limits are found from known 0 & table Sigma-Chart Control Limits: Approximate, asymmetric 3 limits from 0 & table X-Bar & Sigma-Charts • Limits can also be generated from historical data: ENGM 720: Statistical Process Control
Operating Characteristic (OC) Curve • Ability of the x and R charts to detect shifts (sensitivity) is described by OC curves • For x chart; say we know s • Mean shifts fromm0 (in-control value) to m1 = m0 +ks (out-of-control value) • The probability of NOT detecting the shift on the first sample after shift is ENGM 720: Statistical Process Control
OC Curve for x Chart • Plot of b vs. shift size (in std dev units) for various sample sizes n • x chart not effective for small shift sizes, i.e., k 1.5s • Performance gets better for larger n and larger shifts (k) ENGM 720: Statistical Process Control
OC curve for R Chart • Uses distribution of relative range r.v., i.e., • Suppose • s0 - in-control std dev • s1 - out-of-control std dev • OC curve for R chart plots b vs. ratio of in-control to out-of-control standard deviation for various sample sizes • That is, plot β vs. l = s1/s0 • R chart not very effective for detecting shifts for small sample sizes (see Fig. 5-14 in fifth edition of the text) (we won’t plot that here, but … ) ENGM 720: Statistical Process Control
Probability of Detecting Shift for Subsequent Samples • After the shift has occurred: • P(NOT detecting shift ON 1st sample) • P(DETECTING shift ON 1st sample) • P(DETECTING shift ON 2nd sample) • P(DETECTING shift ON rth sample) • P(DETECTING shift BY 2nd sample) • P(DETECTING shift BY rth sample) ENGM 720: Statistical Process Control
Average Run Length (ARL) • Expected number of samples taken before shift is detected is called the Average Run Length (ARL) ENGM 720: Statistical Process Control
Performance of Any Shewhart Control Chart • In-Control ARL: • Average number of points plotted on control chart before a false alarm occurs(ideally, should be large) • Out-of-Control ARL: • Average number of points, after the process goes out-of-control, before the control chart detects it(ideally, should be small) ENGM 720: Statistical Process Control
ARL Curve for x Chart • Plot of ARL1 vs. shift size (in sd units) for various sample sizes n: • Average Time to Signal, (ATS): • Number of time periods that occur until signal is generated on control chart • h - time interval between samples ENGM 720: Statistical Process Control
Questions & Issues ENGM 720: Statistical Process Control