
Graphing Linear Equations: Function Tables and Graphs
E N D
Presentation Transcript
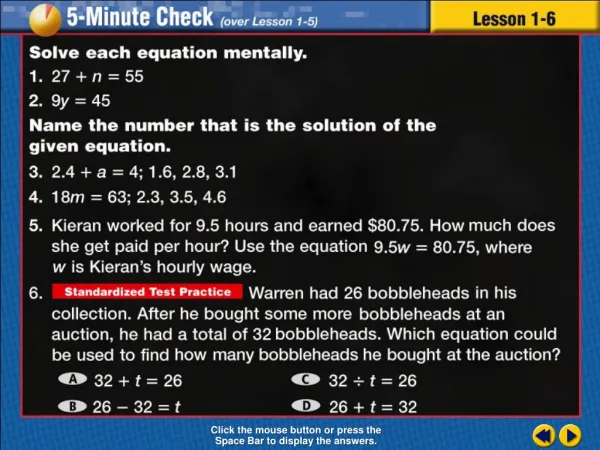
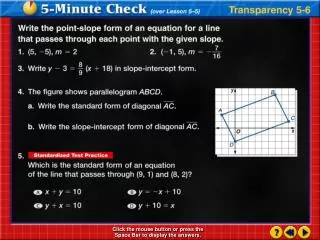
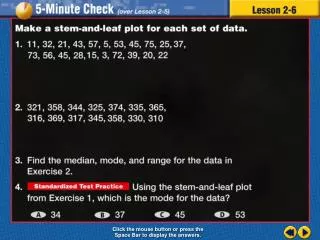
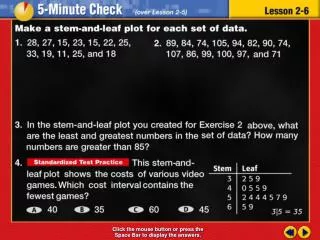
Transparency 6 Click the mouse button or press the Space Bar to display the answers.
Example 6-3c Objective Graph linear equations
Example 6-3c Vocabulary Function A relationship where one thing depends on another
Example 6-3c Vocabulary Function table An organized method of the input numbers, output numbers, and the function rule
Example 6-3c Vocabulary Domain The set of input values
Example 6-3c Vocabulary Range The set of output values
Example 6-3c Vocabulary Linear equation An equation, when graphed, forms a straight line
Example 6-3c Review Vocabulary Ordered pair A pair of numbers used to locate a point in a coordinate system
Lesson 6 Contents Example 1Make a Function Table Example 2Graph Solutions of Linear Equations Example 3Represent Real-World Functions
Example 6-1a WORK Asha makes $6.00 an hour working at a grocery store. Make a function table that shows Asha’a total earnings for working 1, 2, 3, and 4 hours. Make a function table Label columns Input Output Function 1/3
Example 6-1a $6.00 an hour WORK Asha makes $6.00 an hour working at a grocery store. Make a function table that shows Asha’a total earnings for working 1, 2, 3, and 4 hours. total earnings hours Identify the input Identify the function Identify the function Input Output Function Total Earnings ($) Number of Hours Multiply by 6 1/3
Example 6-1a WORK Asha makes $6.00 an hour working at a grocery store. Make a function table that shows Asha’a total earnings for working 1, 2, 3, and 4 hours. hours Put number of hours in the input column Input Output Function Total Earnings ($) Number of Hours Multiply by 6 1 2 3 4 1/3
Example 6-1a WORK Asha makes $6.00 an hour working at a grocery store. Make a function table that shows Asha’a total earnings for working 1, 2, 3, and 4 hours. Multiply the input by 6 to find the output Input Output Function Total Earnings ($) Number of Hours Multiply by 6 1 1 6 6 2 6 2 12 3 3 6 18 4 4 6 24 1/3
Example 6-1a WORK Asha makes $6.00 an hour working at a grocery store. Make a function table that shows Asha’a total earnings for working 1, 2, 3, and 4 hours. Answer: Input Output Function Total Earnings ($) Number of Hours Multiply by 6 1 1 6 6 2 6 2 12 3 3 6 18 4 4 6 24 1/3
Example 6-1b MOVIE RENTAL Dave goes to the video store to rent a movie. The cost per movie is $3.50. Make a function table that shows the amount Dave would pay for renting 1, 2, 3, and 4 movies. Answer: 1/3
Graph Example 6-2a Make a table with 4 columns Label 1st column as “x” Label 2nd column with the rule Label 3rd column as “y” x x + 3 y 2/3 Make a table with an x column, a rule column, a y column, and an ordered pair column
Graph Example 6-2a Label 4th column as the ordered pairs (x, y) Select any four values for the input x I choose 2, 1, 0, and -1 because they are small and easy x x + 3 y (x, y) 5 2 + 3 (2, 5) 2 Substitute the value of x into the function column 1 + 3 4 (1, 4) 1 Make the ordered pairs from the x and y columns 3 0 + 3 (0, 3) 0 -1 -1 + 3 2 (-1, 2) 2/3
Graph Example 6-2a (2, 5) (1, 4) Graph the ordered pairs (0, 3) Label ordered pairs (–1, 2) x x + 3 y (x, y) 5 2 + 3 (2, 5) 2 1 + 3 4 (1, 4) 1 3 0 + 3 (0, 3) 0 -1 -1 + 3 2 (-1, 2) 2/3
Graph Example 6-2a (2, 5) (1, 4) Draw a line connecting the dots (0, 3) (–1, 2) x x + 3 y (x, y) 5 2 + 3 (2, 5) 2 1 + 3 4 (1, 4) 1 3 0 + 3 (0, 3) 0 -1 -1 + 3 2 (-1, 2) 2/3
Graph Example 6-2a (2, 5) (1, 4) Answer: (0, 3) (–1, 2) x x + 3 y (x, y) 5 2 + 3 (2, 5) 2 1 + 3 4 (1, 4) 1 3 0 + 3 (0, 3) 0 -1 -1 + 3 2 (-1, 2) 2/3
Graph Example 6-2b Ordered pairs will vary depending on your choice for x but the line should be alike Answer: 2/3
ANIMALS Blue whales can reach a speed of 30 miles per hour in bursts when in danger. The equation describes the distance d that a whale traveling at that speed can travel in time t. Represent this function with a graph. Example 6-3a Draw a function table with 4 columns t 30t d Label the 1st column with t for time Label the 2nd column with the rule Label the 3rd column with the output for distance d 3/3
ANIMALS Blue whales can reach a speed of 30 miles per hour in bursts when in danger. The equation describes the distance d that a whale traveling at that speed can travel in time t. Represent this function with a graph. Example 6-3a Label 4th column with the ordered pairs t 30t d (t, d) 1 Choose 4 values for the time 2 I choose 1, 2, 3, and 4 hours because they are easy to graph 3 4 3/3
ANIMALS Blue whales can reach a speed of 30 miles per hour in bursts when in danger. The equation describes the distance d that a whale traveling at that speed can travel in time t. Represent this function with a graph. Example 6-3a Substitute the input of t into the function t 30t d (t, d) 1 30 1 30 (1, 30) Find the output d Make ordered pairs from the t and d columns 2 60 (2, 60) 30 2 3 30 3 90 (3, 90) 120 (4, 120) 4 30 4 3/3
Example 6-3a Graph the ordered pairs Label the horizontal axis 140 Label the vertical axis 120 Scale must include 0 - 120 100 80 60 40 20 1 2 3 4 3/3
Example 6-3a Plot each ordered pair 140 Draw a line through the points (4, 120) 120 Answer: 100 (3, 90) 80 60 (2, 60) 40 (1, 30) 20 1 2 3 4 3/3
TRAVEL Susie takes a car trip traveling at an average speed of 55 miles per hour. The equation describes the distance d that Susie travels in time t. Represent this function with a graph. Example 6-3c * Answer: 3/3
End of Lesson 6 Assignment