THIN LAYER CHROMATOGRAPHY
BIOCHEMISTRY

THIN LAYER CHROMATOGRAPHY
E N D
Presentation Transcript
M.PRASAD NAIDU Msc Medical Biochemistry, Ph.D Research scholar. Thin layer chromatography
Introduction • Izmailov & Shraiber separated plant extracts using 2mm thick and firm layer of alumina set on glass plate. • In 1944, Consden, Gorden & Martin used filter papers for separating amino acids. • In 1950, Kirchner identified terpenes on filter paper • In 1958, Stahl developed standard equipment for analysing by TLC.
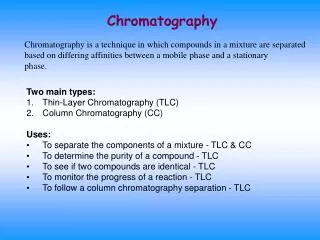
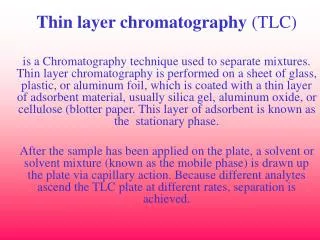
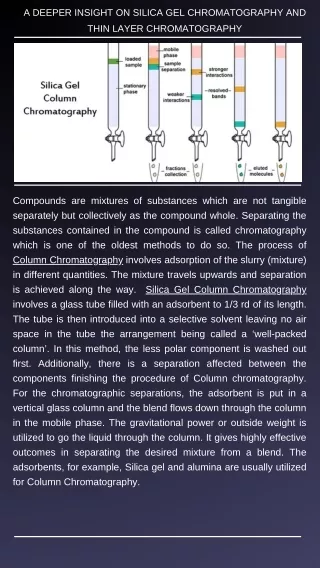
Principle • Adsorption • Separation based on the affinity of the compounds towards the stationary phase. • Stationary phase: thin layer of adsorbent coated on chromatographic plate. • Mobile phase solvent flows through b’cos of capillary action (against gravity) • The components with more affinity towards the stationary phase travels slower. • Lesser affinity towards the stationary phase travels faster.
Advantages pf TLC • 1. Simple method & less expensive • 2. Rapid technique • 3. Separation upto µgms • 4. Any type of compound can be analysed • 5. Efficiency of separation: depends upon the particle size ( small) flow rate ( less viscous) • 6. Detection is easy and not tedious • 7. Capacity of the thin layer can be altered. • 8. Needs less solvent, stationary phase & time • 9. Corrosive spray reagents can be used without damaging the plates.
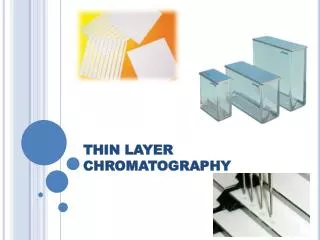
Practical requirements • Stationary phases • Glass plates • Preparation and activation of TLC plates • Application of sample • Development tank • Mobile phase • Development technique • Detecting or visualising agents
Glass Plates • Glass plates 20cmX20cm(full plate), half plate (20x10), quarter plate (20x5) • These dimensions are used since the width of the TLC spreader is 20cm • Microscopic slides can be used for some applications like monitoring the progress of a chemical reaction • The development time is 5 min • Good quality & should withstand temperatures used for drying the plates
Preparation & activation of TLC plates • 1. Pouring: slurry is prepared & poured on glass plate & spread uniformly • Demerit: uniformity in thickness cannot be ensured • 2. Dipping: two plates are dipped into the slurry and are separated after removing from slurry and later dried. • Demerit: larger quantity of slurry is needed • 3. Spraying: using a sprayer • Demerit: layer thickness cannot be maintained uniformly • 4. Spreading : the best technique • Normal thickness 0.25mm for analytical purposes • 2mm thickness for preparative purposes • Oven temperature for drying should be 100-120 for 1 hr.
Application of sample • To get good spots, the conc of the sample has to be minimum • 2-5µl of a 1% solution is spotted using a capillary tube or micropipette. • Spots should be kept atleast 2cm above the base of the plate • Spotting area should not be immersed in the mobile phase
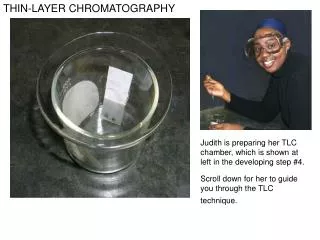
Development tank • Glass beakers, specimen jars • The tank should be lined inside with filter paper moistened with mobile phase so as to saturate the atmosphere • If saturation is not done, edge effect occurs where the solvent front in the middle of TLC plate moves faster than that of the edge.
Mobile phase • The solvent or mobile phase used depends upon • 1. nature of the substances to be separated • 2. nature of the stationary phase used • 3. mode of chromatography ( normal / reverse phase) • 4. separation to be achieved ( analytical / preparative) • Eg: petroleum ether, CCl4, cyclohexane, CS2, Ether, acetone, Benzene, Toluene, Ethylacetate, CHCl3, alcohols, water, pyridine, organic acids,
Development technique • 1. One dimensional development (vertical) • 2. Two dimensional development • 3. Horizontal development • 4. Multiple development • One dimensional development: The plates are kept vertical & the solvent flows against gravity b’cos of capillary action. • Two dimensional development: • This tech is used for complex mixtures • First, the plates are developed in one axis & the plates after drying are developed in the other axis.
Detecting or visualising agents • After the development of TLC plates, the spots should be visualised. • Detecting coloured spots can be done visually. • For colourless spots • 1. Non-specific methods: no. of spots can be detected, but not the exact nature or type of compound • 2. Specific methods: specific spray reagents or detecting agents or visualising agents are used to find out the nature of compounds or for identification purposes.
Non-specific methods • Where the no. of spots can be detected but not the exact nature / type of compound • 1. Iodine chamber method: where brown or amber spots are observed • 2. H2SO4 spray reagent: 70-80% of H2SO4 with few mg of either K2Cr2O7 or KMnO4 or few ml of HNO3 as oxidising agent is used. • After spraying on TLC plates is heated in an oven • Black spots are seen due to charring of compounds
Non-specific methods • 3. UV chamber for fluorescent compounds: when compounds are viewed under UV chamber, at 254nm (short wavelength) or at 365nm (longer) fluorescent compounds can be detected. Bright spots are seen under a dark background. • 4. Using fluorescent stationary phase: when the compounds are non fluorescent, a fluorescent stationary phase is used. When the plates are viewed under UV chamber, dark spots are seen on a fluorescent background. Eg: such stationary phase is Silicagel GF
Specific methods • Specific spray reagents or detecting agents or visualising agents are used to find out the nature of compounds or for identification purposes. • Ex: 1. Ninhydrin for amino acids • 2. FeCl3 phenolic compounds & tannins • 3. Dragendroff’s reagent for alkaloids • 4. 3,5- Dinitrobenzoic acid cardiac glycosides • 5. 2,4-Dinitorphenylhydrazine aldehydes & ketones
Detecting techniques • 2 types • 1. Destructive technique: samples are destroyed • Specific spray reagents, con H2SO4 • 2. Non-Destructive technique: Sample is not destroyed even after detection. This is used in preparative TLC • Eg: UV-chamber method, Iodine chamber method, densitometric method
Densitometric method • Measures the density of the spots • When the optical density of the spots for the standard & the test solution are measured , the quantity of the substance can be calculated. • The plates are neither destroyed nor eluted with solvents to get the compounds. • This method is also called in-situ method
applications • 1. Separation of mixtures of drugs of chemical or biological origin, plant extracts • 2. Separation of carbohydrates, vitamins, antibiotics, proteins, alkaloids, glycosides • 3. identification of drugs • 4. identification of related compounds in drugs • 5. to detect the presence of foreign substances in drugs • 6. to detect decomposition products in drugs
High performance TLC ( HPTLC) • HPTLC is a sophisticated & automated form of TLC. • Features: • 1. the use of precoated plates with stationary phase particle size of <10µ diameter. • 2. wide choice of stationary phases like Silicagel, for normal phase Reverse phase: C18, C8 3. Auto sampler instead of manual spotting and streaking for preparative purposes. 4. New type of development chambers which requires less amt of solvents for developing. 5. More efficiency b’cos smaller & uniform size of adsorbents 6. The use of UV/Vis/Fluorescence scanner which scans the entire chromatogram qualitatively & quantitatively. The scanner is an advanced type of densitometer. 7. Increased data processing capabilities by the use of computers.
Qualitative analysis • Rf value is the ratio of distance travelled by the solute to the distance travelled by the solvent front. • The Rf value ranges from 0 to 1.0 (0.3-0.8) • Rx value: is nothing but the ratio of distance travelled by the sample and the distance travelled by the standard. • Rx value is always closer to 1.0 • Rm value is used in qualitative analysis to find out whether the compounds belong to a homologous series.