Download
1 / 12
120 likes | 231 Views
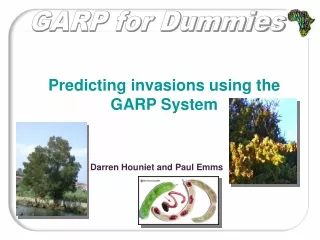
Modelling alien invasives using the GARP system. Some thoughts to bear in mind. James J. Reeler Department of Biodiversity and Conservation Biology University of the Western Cape. Why model species distribution?.

E N D
Modelling alien invasives using the GARP system Some thoughts to bear in mind. James J. Reeler Department of Biodiversity and Conservation Biology University of the Western Cape
Why model species distribution? • Complements BHUs for conservation planning, helping develop irreplaceability ratings • Supplements data for known distribution of species. • Useful for discovering environmental factors that determine distribution. • Particularly useful for extrapolating effects of environmental/climate change. • Useful for estimating potential susceptibility of areas to alien invasives.
Why use GARP? • Implemented for many purposes in recent years, such as modelling invasive species (Peterson & Robins, 2003), infectious diseases, (Peterson & Shaw, 2003), and global warming (Thomas et al, 2004) • Robust and powerful (Stockwell & Noble, 1992; Stockwell & Peters, 1999). • Needs no absence data, and little a priori knowledge. • Little independent testing of the algorithm has been done, and should be carried out (Peterjohn, 2001)
Boolean Vs Probabilistic logic A: A boolean division between two points (categorical data) B: A continuous graduation between points (continuous data)
Depth of topsoil horizon Depth of topsoil horizon (Source: SAAAC) Area is divided into a number of polygons, each with a single value for the given characteristic. Used for categorical data. Detail of Cape Peninsula
Range of minimum temperatures for South Africa (Source: SAAAC) July minimum temperatures for South Africa (Source: SAAAC) Each raster cell has an individual value for the minimum temperature, giving a broad range. Used for continuous data. Detail of Cape Peninsula
Simple Species Envelope The areas in which Protea nitida is known to occur Source: Proteas of Southern Africa
Probabilistic map Highlights areas of higher and lower risk probability. This is useful for planning purposes, because a planner can choose the level at which risk is designated (ie: a high risk area might be one that has a suitability of 90% in the model, or a high risk species may be specified by a coverage of 10% of the study area at a suitability level of 40% or more)
The effects of the number of modelling points used of the effectiveness of GARP
The relationship between Type I and Type II errors (false positives and false negatives) in GARP-modelled distributions
TYPE I ERROR (false positive) Predicts species presence in sites at which it may not be found. Overestimates range, increasing the risk priority of the species. This leads to inclusion of sites of little or no importance for conservation. May falsely skew conservation priorities toward elimination of plant species with low potential impact. TYPE II ERROR (false negative) Failure to predict environmental suitability in a site at which the species is known to occur. May therefore underestimate the overall susceptibility to invasion. Leads to exclusion of sites of possibly vital conservation value. Skews conservation priorities away from alien species with a potentially high invasive impact . Implications of Type I and Type II errors in alien invasive distribution modelling
Conclusions • The conservation objectives for a species should be borne in mind: • When modelling a species for conservation it is better to err on the side of caution and choose a model that minimizes false positive (Type I) errors. • When modelling an invasive species, a model that minimizes false negative (Type II) errors is more useful. • Modelling for species at a fine scale may prove challenging, because obtaining environmental layers at the specified scale can be difficult and local environmental conditions may vary (micro-climate), and the extent of local field work required may be prohibitive. • Probabilistic maps are generally more useful for planning and interpretation, so whenever possible, models should take this into account.