Download
1 / 37
380 likes | 518 Views
Social Change Leaders at PSU: The Multi-Institutional Study of Leadership. 5 th Annual Student Leadership Conference January 26, 2007 Wendy Endress & Shela Perrin.

E N D
Social Change Leaders at PSU: The Multi-Institutional Study of Leadership 5th Annual Student Leadership Conference January 26, 2007 Wendy Endress & Shela Perrin Sponsored by the University of Maryland, National Clearinghouse for Leadership Programs, ACPA Educational Leadership Foundation, & NASPA Foundation MSL/ NCLP, 2006
Presentation Outline • Background & Purpose • Frameworks for the Study • Methodology • Instrument • Participating Institutions • Our Institution’s Findings: • Random v. Comparative Samples • Demographic Results • Environmental Results • Q&A/Discussion
Backgroundof the MSL Rationale #1: “Leadership is one of the most observed and least understood phenomena on earth.” • James MacGregor Burns Leadership (1978), p. 2
Backgroundof the MSL Rationale #2: “In every dimension of contemporary society – church, government, business, and education – we face a crisis of leadership.” • Jeffrey G. Reed & Mary C. Klein, 2005 Concepts & Connections, 13(2), p. 4
Backgroundof the MSL Rationale #3: “Higher education plays a major part in shaping the quality of leadership in modern American society.” • Alexander W. Astin & Helen S. Astin Leadership Reconsidered (2000), p. 2
Purpose of the MSL To examine student leadership values at both the institutional and national levels with specific attention to the environmental factors that influence leadership development in college students.
Frameworkof the MSL Theoretical Framework: Social Change Model of Leadership Development (HERI, 1996) Conceptual Framework: I-E-O College Impact Model (Inputs-Environment-Outcomes) (Astin, 1993, 2001)
The Social Change Model Change
Individual Values: Consciousness of Self Commitment Congruence Community Value: Citizenship Group Values: Collaboration Common Purpose Controversy with Civility Central Value: Change Social Change Model: 8C’s
I-E-OModel • Inputs: students' pre-college characteristics • e.g., demographics, high school achievement • Environment: programs, experiences, relationships, and other factors in the collegiate environment • e.g., co-curricular involvement, mentoring • Outcomes: students' characteristics after exposure to the college environment • e.g., the eight C’s of the Social Change Model
Key Research Questions • How do college students score on the eight leadership values associated with the Social Change Model? • How do scores compare across particular demographic factors, such as gender, race/ethnicity, and class-standing? • What environmental factors (e.g., co-curricular involvement, study abroad) contribute to higher scores on the leadership outcomes?
Methodology • The Survey Instrument: • Web-based (link sent via e-mail) • Average completion time of about 20 minutes • Schools could also ask up to 10 institution-specific custom questions • Pilot tested at the University of Maryland, College Park
Methodology • 54 Participating Institutions: • Geographically diverse • Variety of institutional types and classifications • e.g.: community colleges, women’s colleges, research universities, liberal arts schools, HBCU’s and HSI’s • Differing levels of leadership programming (extensive at some, nascent at others)
Methodology • Random Samples: • A random selection of undergraduate students from each institution (3,000 for most) was invited to participate • Comparative Sample: • Each institution was allowed to identify a second population (up to 500) to serve as a comparison • e.g., Resident Assistants, Leadership Majors & Minors
Methodology • Data Collection & Results • Standard data cleaning techniques were employed • Findings were generated using descriptive and inferential statistical methods and summarized in final report for each institution • Raw data was provided to schools for additional analyses
Response Rates Portland State Univ. Random Sample: • Responses / Invited: 839 / 6000 • Response rate: 14% Portland State Univ. Comparative Sample: • Responses / Invited: 122 / 358 • Response rate: 34% Overall National Sample: • Responses / Invited: 63,085 / 165,701 • Response rate: 38 %
Portland State Univ. Gender: Male: 42.2% Female: 57.7% Transgender: n/a Class Standing: Freshman: 13.3 % Sophomore: 16.7 % Junior: 29.7 % Senior: 40.3 % NATIONAL Gender: Male: 38.3 % Female: 61.5 % Transgender: 0.1 % Class Standing: Freshman: 23.3 % Sophomore: 21.7 % Junior: 26.3 % Senior: 28.8 % Demographics
Portland State Univ. Race/Ethnicity: White: 68.5 % Black / African American: 2.3 % Asian / Asian American: 11 % Latino/a: 3.2 % Amer. Indian: .6 % Multiracial: 10.5 % Not Included: 4.0 % NATIONAL Race/Ethnicity: White: 71.8 % Black / African American: 5.2 % Asian / Asian American: 7.9 % Latino/a: 4.4 % Amer. Indian: 0.3 % Multiracial: 8.2 % Not Included: 2.3 % Demographics
SCM Scores & Statistical Significance • Data highlighted reflects average mean scores of respondents’ responses to statements scored on a 5-point likert scale in Section 18 of the survey • While average scores can be higher or lower they may not infer anything unless there is a “significant” difference in the score • “Significance” means that there is a relationship between two or more variables that statistical analysis indicates is not likely a chance occurrence
Random v. Comparative Our comparative sample included: Ambassadors, ASPSU Elected and Appointed Leaders, Orientation Leaders, Resident Assistants, SALP Peer Advisors, Student Leaders for Service, Student Organization Leaders, UNST Mentors.
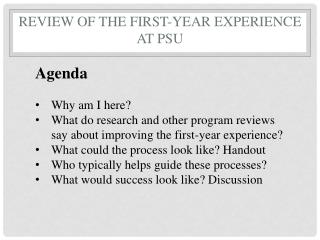
Q&A/Discussion What does this data tell us about . . . • Our school’s students? • Our school’s leadership programs? • Our school’s culture? • Our school’s values and mission? • Our schools’ strengths and weaknesses? • Our school’s future strategies?
For more information Wendy Endress Dean of Students Office of Student Affairs endress@pdx.edu 503.725.4422