Download
1 / 25
360 likes | 758 Views
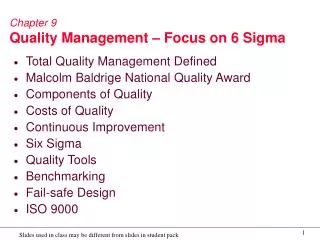
Chapter 9 Quality Management. Total Quality Management (TQM). Total quality management is defined as managing the entire organization so that it excels on all dimensions of products and services that are important to the customer. Quality Specifications.

E N D
Total Quality Management (TQM) • Total quality management is defined as managing the entire organization so that it excels on all dimensions of products and services that are important to the customer
Quality Specifications • Design quality: Inherent value of the product in the marketplace • Dimensions include: Performance, Features, Reliability/Durability, Serviceability, Aesthetics, and Perceived Quality. • Conformance quality: Degree to which the product or service design specifications are met
Appraisal Costs External Failure Costs Prevention Costs Internal FailureCosts Costs of Quality Costs of Quality
Six Sigma Quality • A philosophy and set of methods companies use to eliminate defects in their products and processes • Seeks to reduce variation in the processes that lead to product defects • The name, “six sigma” refers to the variation that exists within plus or minus three standard deviations of the process outputs
Six Sigma Quality (Continued) • Six Sigma allows managers to readily describe process performance using a common metric: Defects Per Million Opportunities (DPMO)
Six Sigma Quality (Continued) So, for every one million letters delivered this city’s postal managers can expect to have 1,000 letters incorrectly sent to the wrong address. Example of Defects Per Million Opportunities (DPMO) calculation. Suppose we observe 200 letters delivered incorrectly to the wrong addresses in a small city during a single day when a total of 200,000 letters were delivered. What is the DPMO in this situation? Cost of Quality: What might that DPMO mean in terms of over-time employment to correct the errors?
Example to illustrate the process… • We are the maker of this cereal. Consumer Reports has just published an article that shows that we frequently have less than 15 ounces of cereal in a box. • What should we do?
Step 1 - Define • What is the critical-to-quality characteristic? • The CTQ (critical-to-quality) characteristic in this case is the weight of the cereal in the box.
2 - Measure • How would we measure to evaluate the extent of the problem? • What are acceptable limits on this measure?
2 – Measure (continued) • Let’s assume that the government says that we must be within ± 5 percent of the weight advertised on the box. • Upper Tolerance Limit = 16 + .05(16) = 16.8 ounces • Lower Tolerance Limit = 16 – .05(16) = 15.2 ounces
2. Measure (continued) • We go out and buy 1,000 boxes of cereal and find that they weight an average of 15.875 ounces with a standard deviation of .529 ounces. • What percentage of boxes are outside the tolerance limits?
Process Mean = 15.875 Std. Dev. = .529 Upper Tolerance = 16.8 Lower Tolerance = 15.2 What percentage of boxes are defective (i.e. less than 15.2 oz)? Z = (x – Mean)/Std. Dev. = (15.2 – 15.875)/.529 = -1.276 Probability corresponding to Z of 1.276 = .898 (from z table) Subtract from 1: 1 - .898 = .102 Approximately, 10 percent of the boxes have less than 15.2 Ounces of cereal in them!
Step 3 - Analyze - How can we improve the capability of our cereal box filling process? • Decrease Variation • Center Process • Increase Specifications
Step 4 – Improve – How good is good enough?“Six Sigma” • 6s minimum from process center to nearest spec
Motorola’s “Six Sigma” • Implies 2 ppB “bad” with no process shift • With 1.5s shift in either direction from center (process will move), implies 3.4 ppm “bad”.
Step 5 – Control • Statistical Process Control (SPC) • Use data from the actual process • Estimate distributions • Look at capability - is good quality possible • Statistically monitor the process over time
Analytical Tools for Six Sigma and Continuous Improvement: Pareto Analysis Can be used to find when 80% of the problems may be attributed to 20% of the causes 80% Frequency Design Assy. Instruct. Purch. Training
Analytical Tools for Six Sigma and Continuous Improvement: Checksheet Can be used to keep track of defects or used to make sure people collect data in a correct manner Monday • Billing Errors • Wrong Account • Wrong Amount • A/R Errors • Wrong Account • Wrong Amount
Analytical Tools for Six Sigma and Continuous Improvement: Histogram Can be used to identify the frequency of quality defect occurrence and display quality performance Number of Lots 0 1 2 3 4 Defectsin lot Data Ranges
Machine Man Effect Environment Method Material Analytical Tools for Six Sigma and Continuous Improvement: Cause & Effect Diagram The results or effect Possible causes: Can be used to systematically track backwards to find a possible cause of a quality problem (or effect)
UCL 1020 1010 1000 LCL 990 980 970 0 1 2 3 4 5 6 7 8 9 10 11 12 13 14 15 Analytical Tools for Six Sigma and Continuous Improvement: Control Charts Can be used to monitor ongoing production process quality and quality conformance to stated standards of quality
Six Sigma Roles and Responsibilities • Executive leaders must champion the process of improvement • Corporation-wide training in Six Sigma concepts and tools • Setting stretch objectives for improvement • Continuous reinforcement and rewards
Service Quality Measurement:Servqual • A perceived service quality questionnaire survey methodology • Examines “Dimensions of Service Quality” including: Reliability, Responsiveness, Assurance, Empathy, and Tangibles (e.g., appearance of physical facilities, equipment, etc.)