Understanding Linear Relationships in Statistical Analysis
290 likes | 382 Views
Explore the concept of regression lines and correlation in AP Statistics using a controlled experiment dataset. Learn how to interpret regression slopes and y-intercepts to predict outcomes.

Understanding Linear Relationships in Statistical Analysis
E N D
Presentation Transcript
Linear relationships between two quantitative variables are quite common. Correlation measures the direction and strength of these relationships. Just as we drew a density curve to model the data in a histogram, we can summarize the overall pattern in a linear relationship by drawing a _______________ on the scatterplot. regression line
Note that regression requires that we have an explanatory variable and a response variable. A regression line is often used to predict the value of y for a given value of x.
Who:______________________________What:______________________________ ______________________________Why:_______________________________When, where, how and by whom? The data come from a controlled experiment in which subjects were forced to overeat for an 8-week period. Results of the study were published in Science magazine in 1999. 16 healthy young adults Exp.-change in NEA (cal) Resp.-fat gain (kg) Do changes in NEA explain weight gain
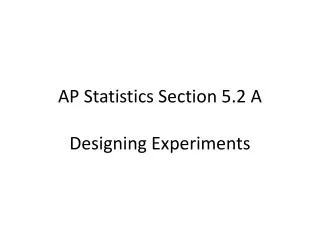
8 6 4 2 0 F a t G a i n (kg) -100 0 100 200 300 400 500 600 700 NEA (calories)
8 6 4 2 0 F a t G a i n (kg) -100 0 100 200 300 400 500 600 700 NEA (calories)
Numerical summary: The correlation between NEA change and fat gain is r = _______
A least-squares regression line relating y to x has an equation of the form ___________In this equation, b is the _____, and a is the __________. slope y-intercept
The formula at the right will allow you to find the value of b:
Once you have computed b, you can then find the value of a using this equation.
Interpreting b: The slope b is the predicted _____________ in the response variable y as the explanatory variable x changes. rate of change
The slope b = -.0034 tells us that fat gain goes down by .0034 kg for each additional calorie of NEA.
You cannot say how important a relationship is by looking at how big the regression slope is.
Interpreting a:The y-intercept a= 3.505 kg is the fat gain estimated by the model if NEA does not change when a person overeats.
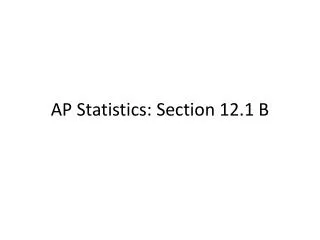
Model: Using the equation above, draw the LSL on your scatterplot.
8 6 4 2 0 F a t G a i n (kg) -100 0 100 200 300 400 500 600 700 NEA (calories)
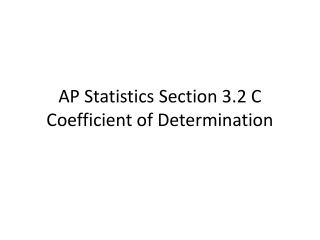
Prediction: Predict the fat gain for an individual whose NEA increases by 400 cal by:(a) using the graph ___________(b) using the equation _________
8 6 4 2 0 F a t G a i n (kg) -100 0 100 200 300 400 500 600 700 NEA (calories)
Prediction: Predict the fat gain for an individual whose NEA increases by 400 cal by:(a) using the graph ___________(b) using the equation _________
Prediction: Predict the fat gain for an individual whose NEA increases by 400 cal by:(a) using the graph ___________(b) using the equation _________
Predict the fat gain for an individual whose NEA increases by 1500 cal.
So we are predicting that this individual loses fat when he/she overeats. What went wrong? 1500 is way outside the range of NEA values in our data
Extrapolation is the use of a regression line for prediction outside the range of values of the explanatory variable x used to obtain the line. Such predictions are often not accurate.
a b