
Comparative Analysis of CrbpI and CrbpIII: Fluorescence Emission and Retinoid Conversion
This study presents a detailed comparison of CrbpI and CrbpIII, focusing on fluorescence emission dynamics and retinoid conversion activities. We demonstrate fluorescence quenching of intrinsic tryptophan in CrbpIII upon ligand binding, aligning with observed behaviors in CrbpI. The normalized excitation and emission spectra for both proteins are provided. Additionally, we quantify Lrat and Rdh reductase activity through retinol conversion assays involving Crbp proteins. Data highlights significant differences between genotypes and their respective interaction with retinoids, with clear implications for understanding retinoid metabolism.

Comparative Analysis of CrbpI and CrbpIII: Fluorescence Emission and Retinoid Conversion
E N D
Presentation Transcript
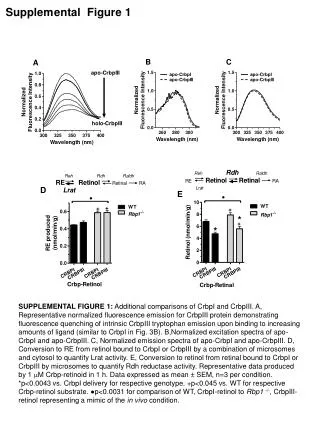
SUPPLEMENTAL FIGURE 1: Additional comparisons of CrbpI and CrbpIII. A, Representative normalized fluorescence emission for CrbpIII protein demonstrating fluorescence quenching of intrinsic CrbpIII tryptophan emission upon binding to increasing amounts of ligand (similar to CrbpI in Fig. 3B). B,Normalized excitation spectra of apo-CrbpI and apo-CrbpIII. C, Normalized emission spectra of apo-CrbpI and apo-CrbpIII. D, Conversion to RE from retinol bound to CrbpI or CrbpIII by a combination of microsomes and cytosol to quantify Lrat activity. E, Conversion to retinol from retinal bound to CrbpI or CrbpIII by microsomes to quantify Rdh reductase activity. Representative data produced by 1 mM Crbp-retinoid in 1 h. Data expressed as mean ± SEM, n=3 per condition. *p<0.0043 vs. CrbpI delivery for respective genotype. +p<0.045 vs. WT for respective Crbp-retinol substrate. ●p<0.0031 for comparison of WT, CrbpI-retinol to Rbp1 -/-, CrbpIII-retinol representing a mimic of the in vivo condition.